


In my daily quantitative research and market strategy development, I primarily rely on standardized aggregated candlestick datasets, including 1-minute, hourly, and daily charts. These pre-processed market data files feature neat structures and low development thresholds, perfectly fitting basic trend analysis and conventional data statistics.
However, aggregated K-line data has inherent limitations in high-precision quantitative scenarios. All fleeting market micro-fluctuations, frequent transaction changes, and short-term capital activity traces are erased during the data aggregation process. When conducting in-depth market microstructure analysis, high-frequency strategy backtesting, and custom model training, traditional candlestick data can no longer meet refined research requirements.
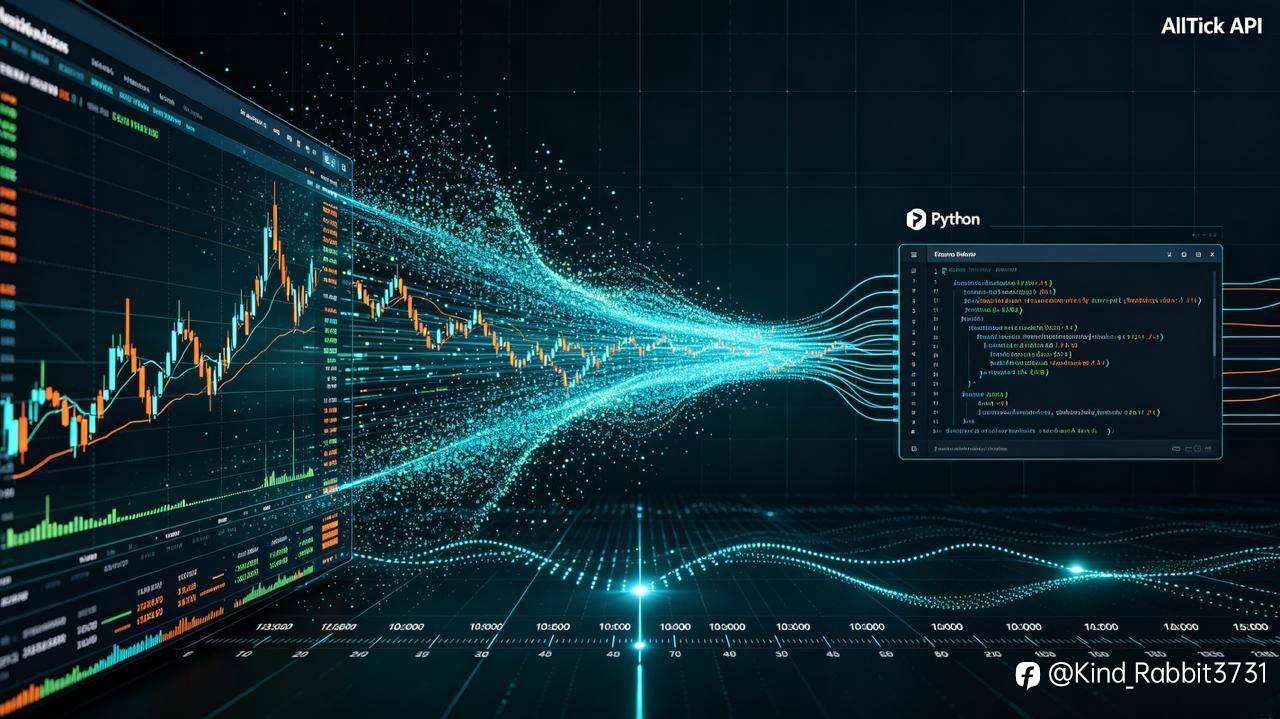
To break through the precision bottleneck of conventional market data, I explored and implemented full access and development of US stock tick data while building a real-time market analysis system. Unlike ordinary aggregated market interfaces, tick-by-tick data records every single transaction behavior in the US stock market, delivering ultra-fine-grained market information. The entire development chain including data reception, structural parsing, persistent storage, and operational calculation requires customized independent design. I adopted AllTick API to complete stable real-time subscription and verification of US stock tick streaming data in this practice.
Core Attributes of US Stock Tick Data
Simply defined, tick data refers to the original unprocessed transaction logs of the stock market. It eliminates artificial cycle aggregation and fully retains complete information of each on-site matching trade, serving as the most authentic data basis for restoring real market trading dynamics.
Compared with minute-level candlestick data, tick data provides comprehensive microscopic market dimensions. Researchers can accurately capture short-term trading frequency fluctuations, subtle price oscillation rhythms, and instantaneous volume mutation signals that cannot be identified by aggregated charts. It is an essential underlying data source for building real-time market early warning systems and developing personalized quantitative analysis models.
Real-Time Data Transmission Pain Points: HTTP Polling vs WebSocket Streaming
Data transmission architecture determines the real-time performance and integrity of quantitative market acquisition. In early development attempts, I adopted the traditional HTTP polling mode to obtain real-time market snapshots. This method is simple to implement but has obvious drawbacks in high-frequency tick data scenarios.
HTTP polling requires continuous active request sending and result waiting by the program. During active US stock trading hours with intensive transaction updates, frequent requests generate massive redundant network overhead. Meanwhile, fixed polling intervals inevitably cause data transmission delays and partial loss of instantaneous transaction records, resulting in distorted backtest results and inaccurate strategy signal capture.
WebSocket persistent connection is the optimal solution for high-frequency real-time data streams. After a two-way long connection is established, the server actively pushes newly generated tick data to the client without repeated manual requests. This mechanism effectively reduces transmission latency, ensures full data coverage, and perfectly matches the ultra-high-frequency update characteristics of US stock tick data.
Python Implementation: Real-Time US Stock Tick Data Subscription & Parsing
The following Python code realizes full-process WebSocket connection establishment, target stock subscription, real-time tick data parsing, and exception monitoring. It can be directly deployed for quantitative research and real-time market debugging.
import websocket
import json
def on_open(ws):
subscribe_data = {
"action": "subscribe",
"symbol": "AAPL",
"type": "trade"
}
ws.send(json.dumps(subscribe_data))
def on_message(ws, message):
data = json.loads(message)
symbol = data.get("symbol")
price = data.get("price")
volume = data.get("volume")
timestamp = data.get("timestamp")
print(
f"{symbol} price:{price} volume:{volume} time:{timestamp}"
)
def on_error(ws, error):
print("error:", error)
def on_close(ws):
print("connection closed")
ws = websocket.WebSocketApp(
"wss://api.alltick.co/stock/websock...",
on_open=on_open,
on_message=on_message,
on_error=on_error,
on_close=on_close
)
ws.run_forever()
The above code covers three core execution logics: initializing a stable WebSocket connection, sending asset subscription instructions, and parsing and printing real-time tick data pushed by the server. It also integrates complete error feedback and disconnection monitoring functions to guarantee continuous program operation.
From the perspective of engineering practice, complex synchronous computing operations should be avoided immediately after receiving tick data in formal projects. The standardized processing logic is to cache the original tick data into a message queue first, and then complete asynchronous data cleaning, aggregation calculation and statistical analysis through independent business modules to prevent main thread blockage and data backlog
Core Optimization Strategies for Tick Data Processing Engineering
US stock tick data features ultra-high update frequency and large data throughput. Coupling data reception, format parsing, operational calculation and persistent storage in a single execution process will seriously reduce program operating efficiency and easily cause system stuttering and data accumulation.
Modular decoupling design is the mainstream and most reliable processing scheme in the quantitative industry, with independent functional divisions as follows:
Connection Maintenance Module: Stabilizes long connection status, automatically executes reconnection logic, and ensures uninterrupted data stream transmission.
Data Processing Module: Completes abnormal data filtering, field verification and unified format conversion to standardize original tick data structure.
Data Storage Module: Persistently archives full historical tick transaction records to support subsequent data replay, strategy backtesting and statistical research.
Data Analysis Module: Aggregates original tick data to generate technical indicators and customized cycle candlestick charts.
This modular architecture delivers excellent scalability. When non-standard cycle charts such as 5s or 30s K-lines are required in subsequent research, only the aggregation logic of the analysis module needs adjustment, without modifying the underlying data receiving framework.
Unified timestamp standardization is another easily overlooked but critical detail. Different data sources output time fields in inconsistent formats, including Unix timestamps and formatted time strings. Without unified conversion processing, subsequent time-series sorting, data statistics and historical market replay will produce obvious systematic deviations.
Practical Application Scenarios of US Stock Tick Data
Beyond real-time price viewing, tick-by-tick data serves as the core underlying support for most advanced quantitative data analysis, with typical application scenarios covering:
Generating customized cycle candlestick charts to break the limitations of fixed official market cycles;
Quantifying short-term trading density and volume fluctuation changes to capture implicit capital movement signals;
Building self-developed real-time market display and intelligent monitoring systems;
Providing high-precision fine-grained data input for quantitative strategies and market research models.
Although tick data requires more standardized engineering processing than ready-made aggregated candlestick data, it completely retains the full dimensional details of market transactions, which is irreplaceable for refined quantitative research.
Practical Development Experience & Summary
After long-term iterative development of real-time market systems, I have summarized a key rule: the stability of a quantitative market system does not depend on data acquisition capability, but on the standardized and complete post-processing workflow.
A reliable tick market system must fully consider connection exception handling, intelligent data caching, automatic error recovery and unified data formatting. Only by optimizing these basic engineering links can the upper-level data analysis and strategy modeling functions operate stably for a long time.
US stock tick data is merely a primitive market data resource. Its practical research and commercial value is determined by the developer’s data management and utilization logic. For researchers dedicated to in-depth market microstructure analysis and high-precision quantitative strategy optimization, tick-by-tick data expands the depth and dimension of market research, and provides sufficient iterative space for quantitative data processing systems.
편집됨
면책 조항: 본 게시글에 표현된 견해는 전적으로 작성자의 견해이며 Followme의 공식 입장을 대변하지 않습니다. Followme는 제공된 정보의 정확성, 완전성 또는 신뢰성에 대해 책임을 지지 않으며, 서면으로 명시적으로 언급되지 않는 한 해당 내용을 기반으로 취해진 어떠한 조치에 대해서도 책임을 지지 않습니다.

