


Gold Technical Analysis (4H Chart)
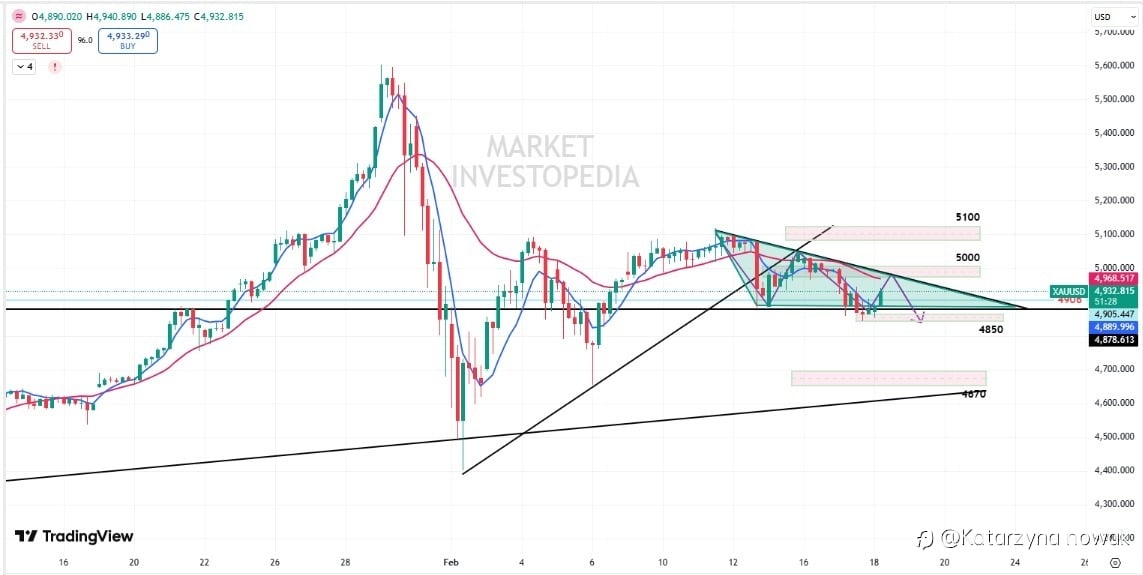
Gold’s broader trend remains bullish; however, on the 4-hour timeframe, price action is developing within a descending triangle pattern, indicating potential short-term consolidation or corrective pressure.
Prices are currently holding above the pivot level at 4906 and attempting to test the upper trendline of the formation. A temporary pullback from this region remains possible.
A decisive break below the immediate support at 4850 (S1) could accelerate short-term bearish momentum, potentially exposing S2 at 4670.
#XAU/USD# #gold# #CrazyGold# #GOLDTODAY# #trading#
면책 조항: 본 게시글에 표현된 견해는 전적으로 작성자의 견해이며 Followme의 공식 입장을 대변하지 않습니다. Followme는 제공된 정보의 정확성, 완전성 또는 신뢰성에 대해 책임을 지지 않으며, 서면으로 명시적으로 언급되지 않는 한 해당 내용을 기반으로 취해진 어떠한 조치에 대해서도 책임을 지지 않습니다.

