


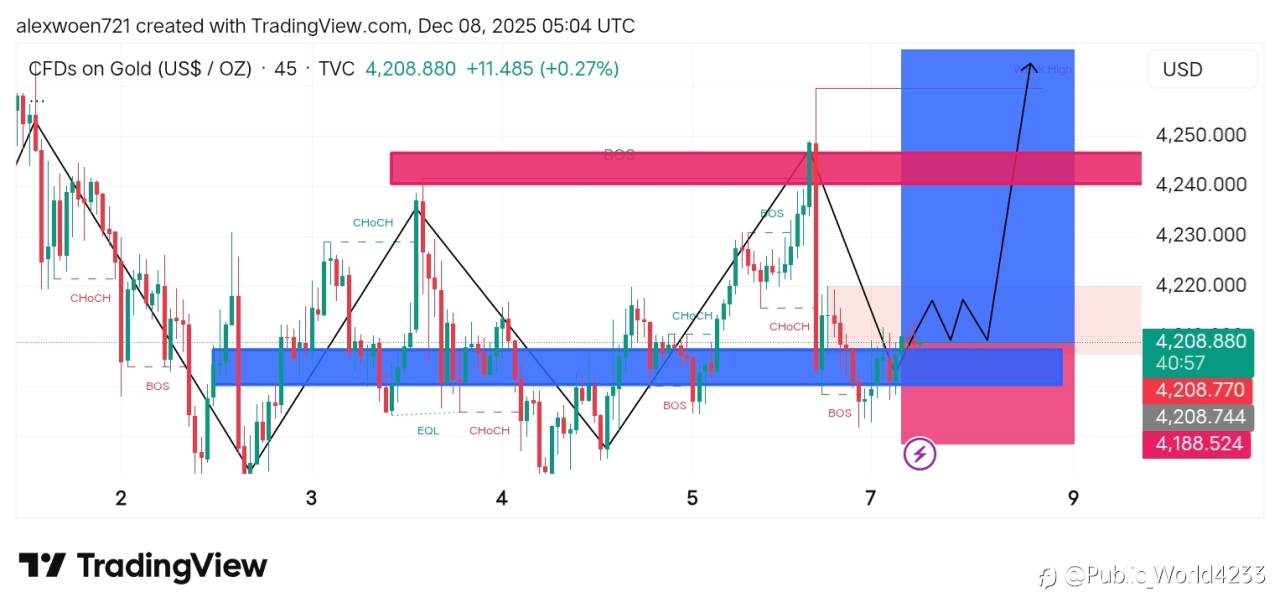
The chart shows a technical analysis of Gold (US$/OZ) with several marked signals:
1. *BOS (Break of Structure)* – indicates a bullish shift in market structure, signaling potential long opportunities.
2. *CHoCH (Change of Character)* – marks a reversal in trend momentum, suggesting a new direction in price action.
3. *EQL (Equal Low)* – highlights a support level where price has formed a double bottom, often used for entry on bounce.
4. *Blue rectangle* – represents a demand zone (support) wher
면책 조항: 본 게시글에 표현된 견해는 전적으로 작성자의 견해이며 Followme의 공식 입장을 대변하지 않습니다. Followme는 제공된 정보의 정확성, 완전성 또는 신뢰성에 대해 책임을 지지 않으며, 서면으로 명시적으로 언급되지 않는 한 해당 내용을 기반으로 취해진 어떠한 조치에 대해서도 책임을 지지 않습니다.

더 오래된 의견은 없습니다. 소파를 가장 먼저 잡으십시오.