


Analysis -
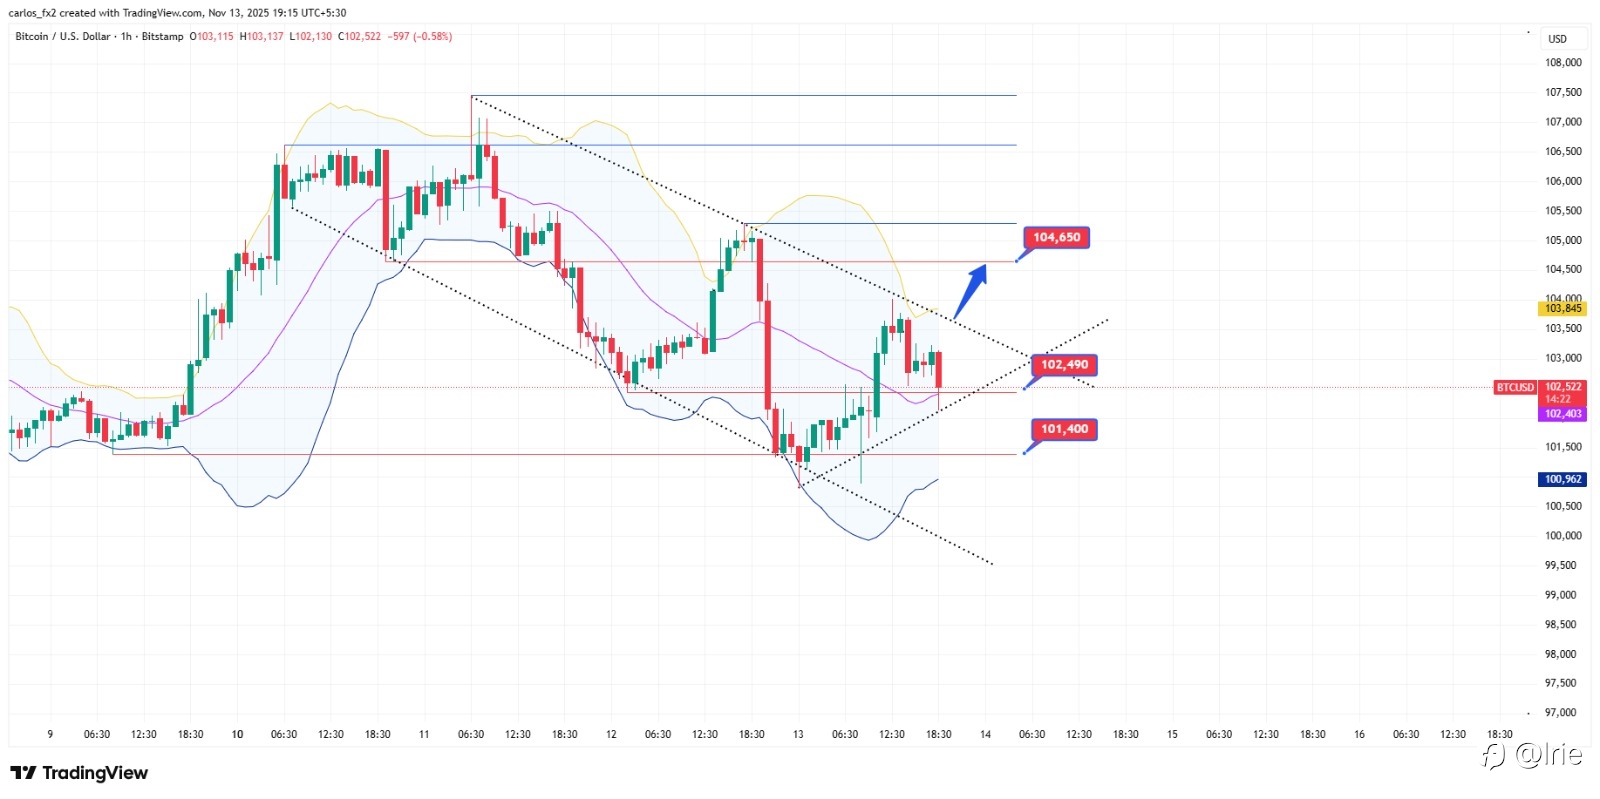
Bitcoin (BTCUSD) is currently trading near the $102,500 mark, moving within a descending channel structure while showing early signs of a possible breakout attempt. The price recently rebounded from the $101,400 support region and is testing the $102,490 mid-level resistance. The Bollinger Bands indicate moderate volatility, with the price holding above the lower band — suggesting a potential near-term recovery if momentum builds.
Outlook -
• On the Upside :
A break and close above $102,490 could open the path toward $104,650, aligning with the upper boundary of the descending channel and the next significant resistance zone. Sustained bullish momentum beyond $104,650 could trigger a further push toward the $106,000–$107,000 area.
• On the Downside :
If BTC fails to hold above $102,000, renewed selling pressure may drag it back toward $101,400, with further downside risk toward the $100,962 support base. A breakdown below this zone could invalidate short-term bullish momentum and expose $100,000 psychological support.
Trend -
The short-term trend remains neutral-to-bearish within the descending channel. However, price action near $102,000–$101,400 shows a base-building pattern. A confirmed breakout above $102,490–$104,650 would shift momentum back to the bullish side.
Strategy -
• Bullish Setup: Consider buying on dips near $101,400–$101,000, targeting $102,490 initially and $104,650 on breakout confirmation.
• Bearish Setup: A close below $101,400 could invite short opportunities toward $100,962 and $100,000, with tight risk management.
Key Levels -
• Resistance (R2): $104,650
• Resistance (R1): $102,490
• Support (S1): $101,400
• Support (S2): $100,962
• Psychological Level: $100,000
면책 조항: 본 게시글에 표현된 견해는 전적으로 작성자의 견해이며 Followme의 공식 입장을 대변하지 않습니다. Followme는 제공된 정보의 정확성, 완전성 또는 신뢰성에 대해 책임을 지지 않으며, 서면으로 명시적으로 언급되지 않는 한 해당 내용을 기반으로 취해진 어떠한 조치에 대해서도 책임을 지지 않습니다.

