#cadchf #cad #chf
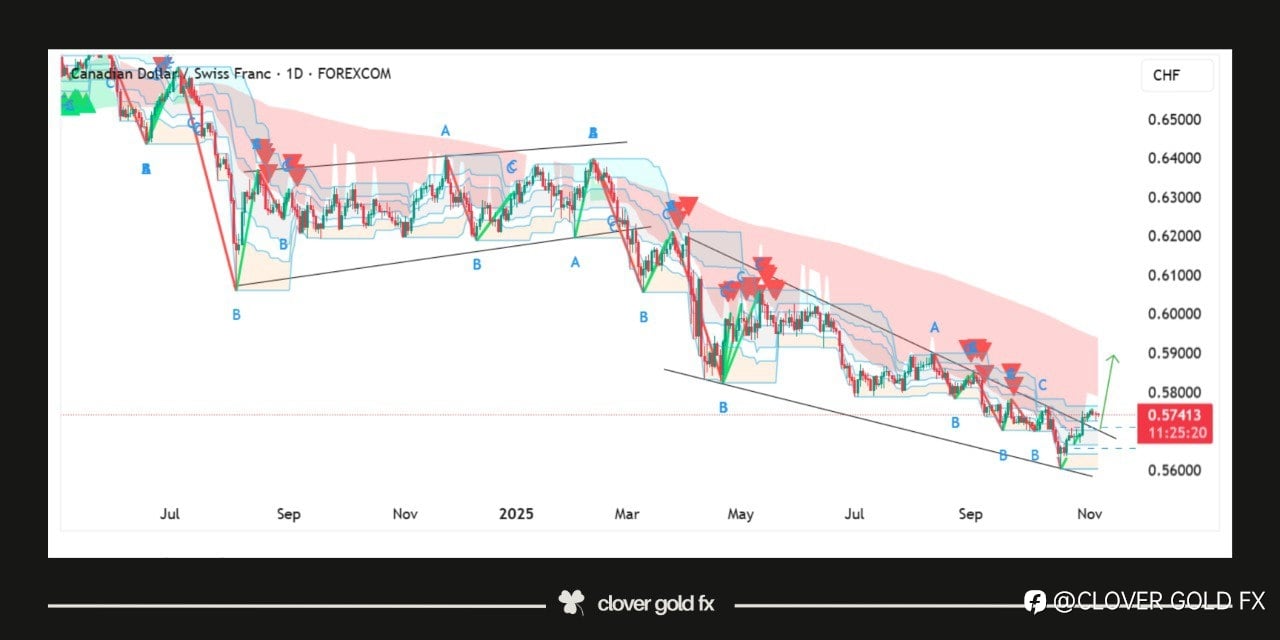
The CADCHF 14H chart shows that the pair has been trading in a clear downtrend forming a falling wedge pattern after an extended bearish move. The recent solid breakout from the wedge signals a potential shift in momentum as buyers start gaining strength. The breakout candle indicates increased bullish activity suggesting that the market may attempt a corrective rally toward the next resistance area shown by the red arrow. This upward move represents a possible reversal phase where price could retest previous structure levels before deciding its next major direction. Overall the chart reflects early signs of recovery with the breakout acting as a key confirmation for short term bullish continuation.
면책 조항: 본 게시글에 표현된 견해는 전적으로 작성자의 견해이며 Followme의 공식 입장을 대변하지 않습니다. Followme는 제공된 정보의 정확성, 완전성 또는 신뢰성에 대해 책임을 지지 않으며, 서면으로 명시적으로 언급되지 않는 한 해당 내용을 기반으로 취해진 어떠한 조치에 대해서도 책임을 지지 않습니다.

더 오래된 의견은 없습니다. 소파를 가장 먼저 잡으십시오.