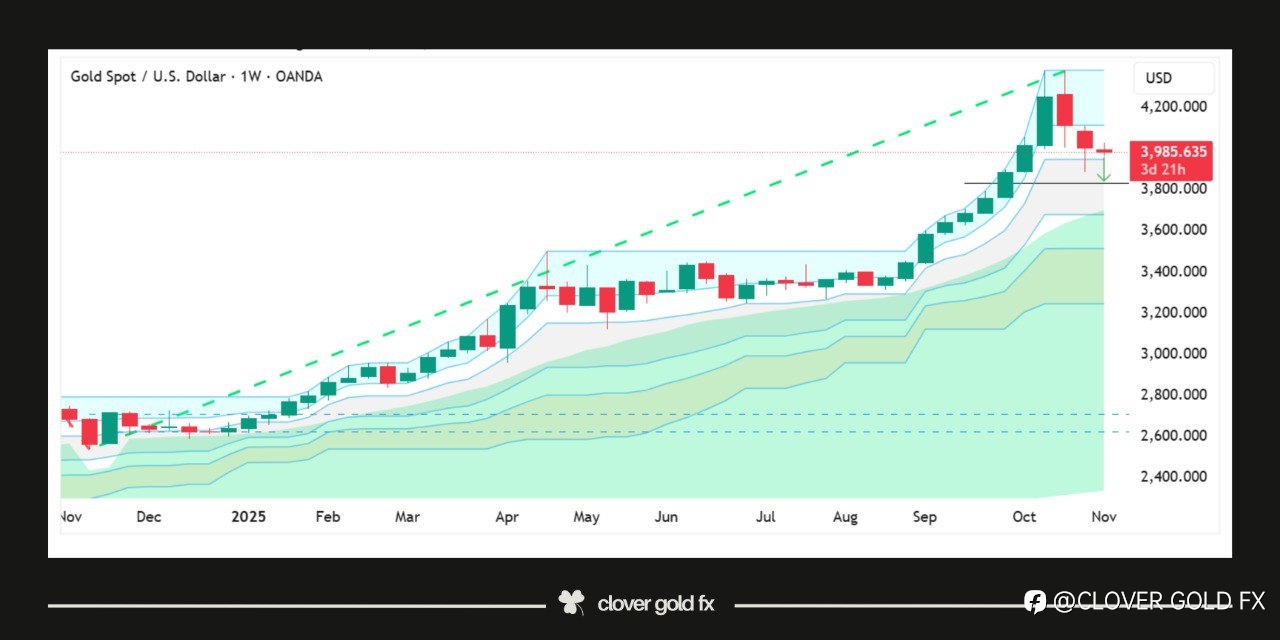
After completing a strong nine-week bullish sequence on the weekly chart, XAUUSD appears to be entering a corrective phase that mirrors previous market behavior seen after extended impulsive rallies. Historically, such prolonged bullish runs often trigger profit-taking and short-term reversals as momentum fades and institutional traders rebalance positions. The current structure shows signs of exhaustion at the top, with a shift from large impulsive candles to smaller corrective ones, suggesting reduced buying pressure. If history repeats, gold may retrace toward the 50% Fibonacci zone, a level that often acts as a natural equilibrium between buyers and sellers before the broader trend resumes. This area also aligns with prior consolidation zones, making it a potential demand region where new accumulation could begin if the long-term uptrend remains intact.
면책 조항: 본 게시글에 표현된 견해는 전적으로 작성자의 견해이며 Followme의 공식 입장을 대변하지 않습니다. Followme는 제공된 정보의 정확성, 완전성 또는 신뢰성에 대해 책임을 지지 않으며, 서면으로 명시적으로 언급되지 않는 한 해당 내용을 기반으로 취해진 어떠한 조치에 대해서도 책임을 지지 않습니다.

더 오래된 의견은 없습니다. 소파를 가장 먼저 잡으십시오.