#xauusd #xᴀᴜᴜsᴅ
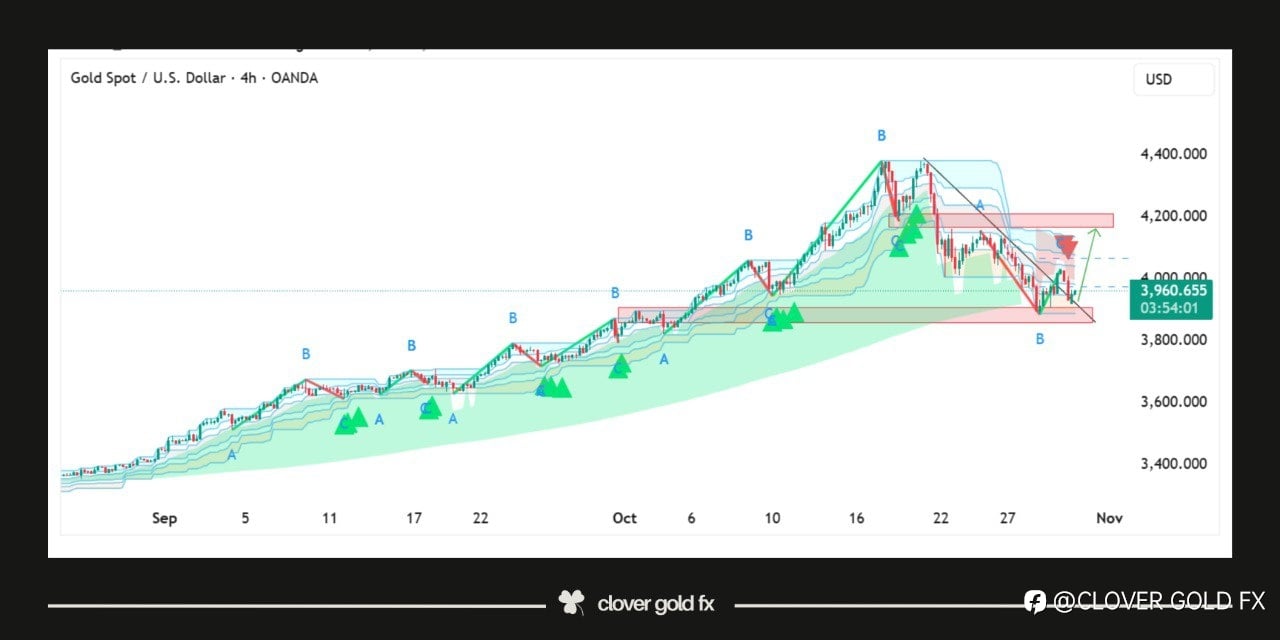
Gold on the 4H chart shows that the market completed a five wave bullish structure and after reaching the top it started a corrective phase that moved down in three clear waves labeled a b and c the price is reacting around the horizontal support zone where buyers are trying to regain control the descending trend line marks the limit of the corrective phase and a breakout above it may indicate the start of a fresh upward movement the pattern suggests that gold might build strength around this area before targeting higher levels again showing a possible shift from correction to continuation of the overall bullish trend
면책 조항: 본 게시글에 표현된 견해는 전적으로 작성자의 견해이며 Followme의 공식 입장을 대변하지 않습니다. Followme는 제공된 정보의 정확성, 완전성 또는 신뢰성에 대해 책임을 지지 않으며, 서면으로 명시적으로 언급되지 않는 한 해당 내용을 기반으로 취해진 어떠한 조치에 대해서도 책임을 지지 않습니다.
더 오래된 의견은 없습니다. 소파를 가장 먼저 잡으십시오.