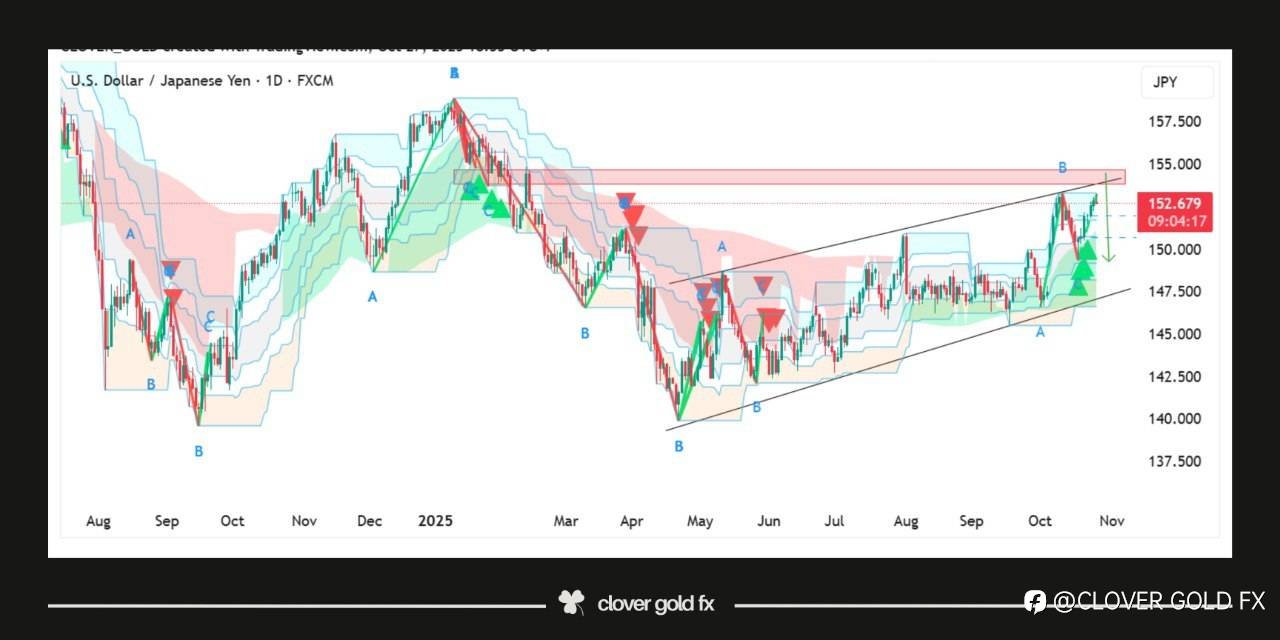
USDJPY shows a bearish setup on the daily chart as the pair has reached the golden Fibonacci resistance level and started to face strong rejection from that zone the structure forms an ending diagonal pattern suggesting potential downside pressure the highlighted red arrows indicate a possible drop as price completes the final wave E of the pattern momentum is losing strength near the upper trendline confirming the likelihood of reversal sellers may take control soon leading to a downward correction toward the lower boundary of the channel this setup reflects a shift from bullish exhaustion to bearish momentum in the coming sessions
면책 조항: 본 게시글에 표현된 견해는 전적으로 작성자의 견해이며 Followme의 공식 입장을 대변하지 않습니다. Followme는 제공된 정보의 정확성, 완전성 또는 신뢰성에 대해 책임을 지지 않으며, 서면으로 명시적으로 언급되지 않는 한 해당 내용을 기반으로 취해진 어떠한 조치에 대해서도 책임을 지지 않습니다.

더 오래된 의견은 없습니다. 소파를 가장 먼저 잡으십시오.