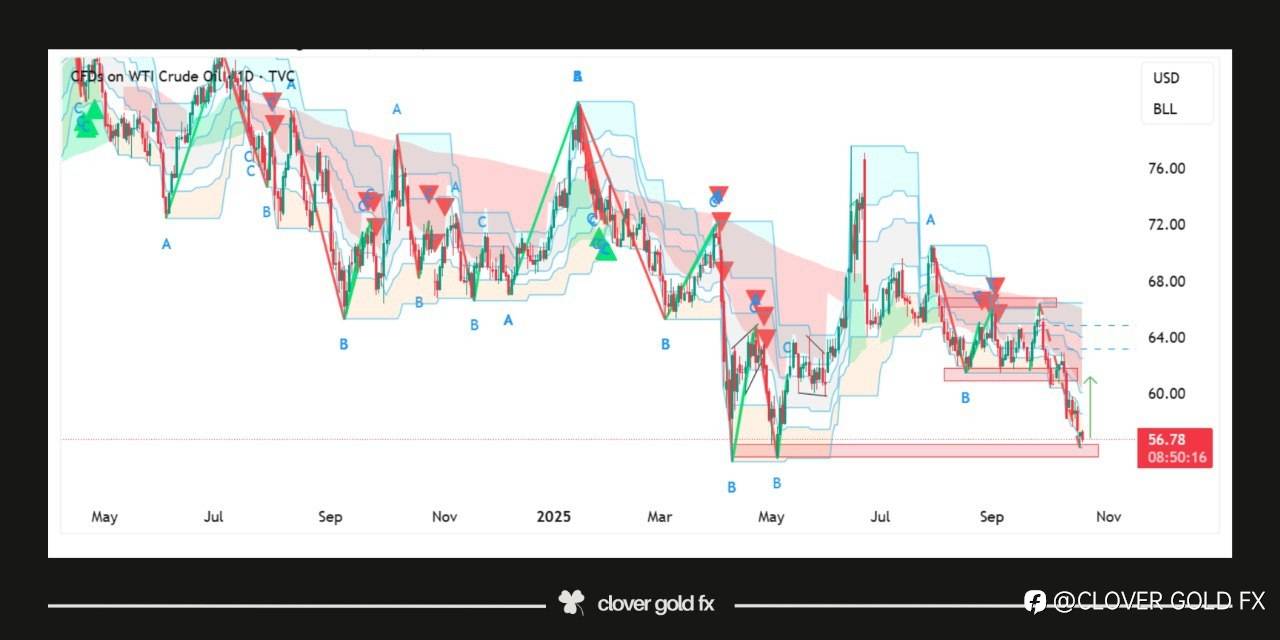
#usoil
The daily chart of US Oil shows a clear technical structure indicating potential bullish momentum ahead. After an extended downtrend the market has formed a triple bottom pattern which often signals exhaustion of selling pressure and a possible reversal. The appearance of a bullish hammer at this key support zone further strengthens the idea that buyers are stepping in to defend the area. Following the earlier range breakout and rejection from horizontal resistance the price has now returned to a major demand region where previous reactions have occurred. This combination of patterns suggests that the market could soon experience upward movement as sentiment shifts from bearish to bullish with traders watching closely for confirmation of continued strength in the coming sessions.
면책 조항: 본 게시글에 표현된 견해는 전적으로 작성자의 견해이며 Followme의 공식 입장을 대변하지 않습니다. Followme는 제공된 정보의 정확성, 완전성 또는 신뢰성에 대해 책임을 지지 않으며, 서면으로 명시적으로 언급되지 않는 한 해당 내용을 기반으로 취해진 어떠한 조치에 대해서도 책임을 지지 않습니다.

더 오래된 의견은 없습니다. 소파를 가장 먼저 잡으십시오.