


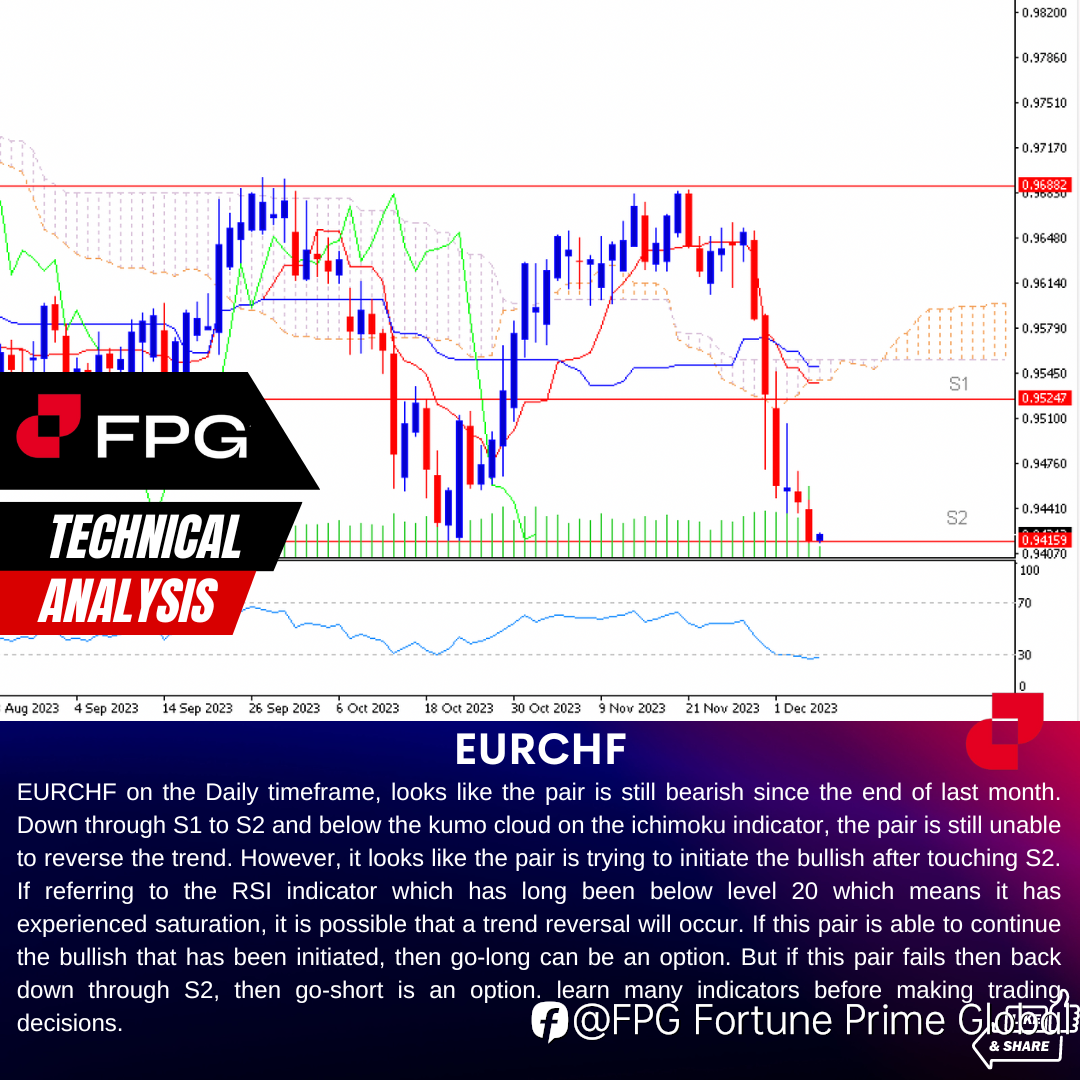
EURCHF on the Daily timeframe, looks like the pair is still bearish since the end of last month. Down through S1 to S2 and below the kumo cloud on the ichimoku indicator, the pair is still unable to reverse the trend. However, it looks like the pair is trying to initiate the bullish after touching S2. If referring to the RSI indicator which has long been below level 20 which means it has experienced saturation, it is possible that a trend reversal will occur. If this pair is able to continue the bullish that has been initiated, then go-long can be an option. But if this pair fails then back down through S2, then go-short is an option. learn many indicators before making trading decisions.
Read more our Technical analysis :
https://bit.ly/3C1NoAY
#FPG #Fortuneprimeglobal #forexlifestyle #intraday #money #cryptocurrency #finance #forexsignals #daytrading #wallstreet #forextrader #investing #forexanalysis #forextrading #stocks #business #daytrader #crypto #forexeducation #trader #trading
면책 조항: 본 게시글에 표현된 견해는 전적으로 작성자의 견해이며 Followme의 공식 입장을 대변하지 않습니다. Followme는 제공된 정보의 정확성, 완전성 또는 신뢰성에 대해 책임을 지지 않으며, 서면으로 명시적으로 언급되지 않는 한 해당 내용을 기반으로 취해진 어떠한 조치에 대해서도 책임을 지지 않습니다.

