


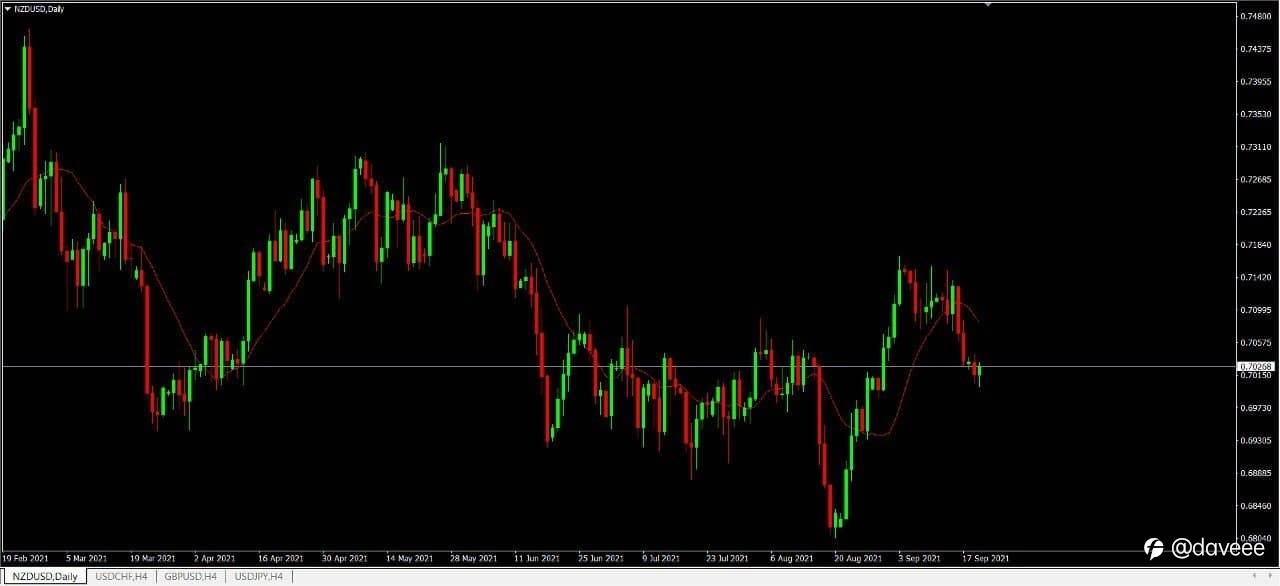
NZD/USD DAILY CHART ANALYSIS
Always keep track that a head-and-shoulders position materialized in the first quarter of 2021 as NZD/USD slipped below the 50-Day SMA (0.7006) this is the first time this has happened since November, with the exchange rate pushing below the 200-Day SMA (0.7116) for the first time since June 2020 to trade to a fresh yearly low (0.6805) in August.
Although, NZD/USD reversed course ahead of the November 2020 low (0.6589) among the failed attempt to close below the 0.6810 (38.2% expansion) region, with a bull flag formation taking shape earlier this month as the exchange rate cleared the July high (0.7105).
☎️ Telegram : https://t.me/MU_I09
📧 Email: [email protected]
#cpt #cptinternational #gold #forex #crudeoil #currency #investment #stock #mt4 #tradingapp #trading #technicalanalysis #USD #NZD @CPT International
면책 조항: 본 게시글에 표현된 견해는 전적으로 작성자의 견해이며 Followme의 공식 입장을 대변하지 않습니다. Followme는 제공된 정보의 정확성, 완전성 또는 신뢰성에 대해 책임을 지지 않으며, 서면으로 명시적으로 언급되지 않는 한 해당 내용을 기반으로 취해진 어떠한 조치에 대해서도 책임을 지지 않습니다.

더 오래된 의견은 없습니다. 소파를 가장 먼저 잡으십시오.