


WTI PRICE ANLYSIS: DAILY CHART
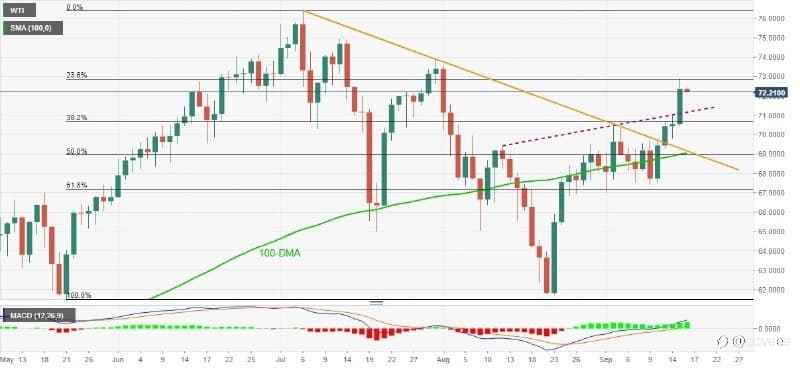
WTI combines weekly gains around multi-day high, 0.20% intraday near $72.20 during early Thursday. The oil standard jumped to the highest level since August 02 but failed to cross 23.6% Fibonacci retracement of May–July upside.
Even so, bullish MACD and the Oil's ability to cross monthly resistance line, falling trend line from early July, also stay firmer beyond 100-DMA, keep WTI oil buyers confident.
As of now, an upside clearance of the 23.6% Fibonacci retracement level of $72.85 will aim for July 30 top of $73.88 and the mid-July peak surrounding $75.00
Hello Traders keep a close look at oil's price for we are still expecting a bullish continuation meaning Buyers can still take advantage of this movement and turn this into profit however scalpers can also earn from the minor bounce back down or its retracement cause price might go down before it continues its bullish movement
면책 조항: 본 게시글에 표현된 견해는 전적으로 작성자의 견해이며 Followme의 공식 입장을 대변하지 않습니다. Followme는 제공된 정보의 정확성, 완전성 또는 신뢰성에 대해 책임을 지지 않으며, 서면으로 명시적으로 언급되지 않는 한 해당 내용을 기반으로 취해진 어떠한 조치에 대해서도 책임을 지지 않습니다.

