
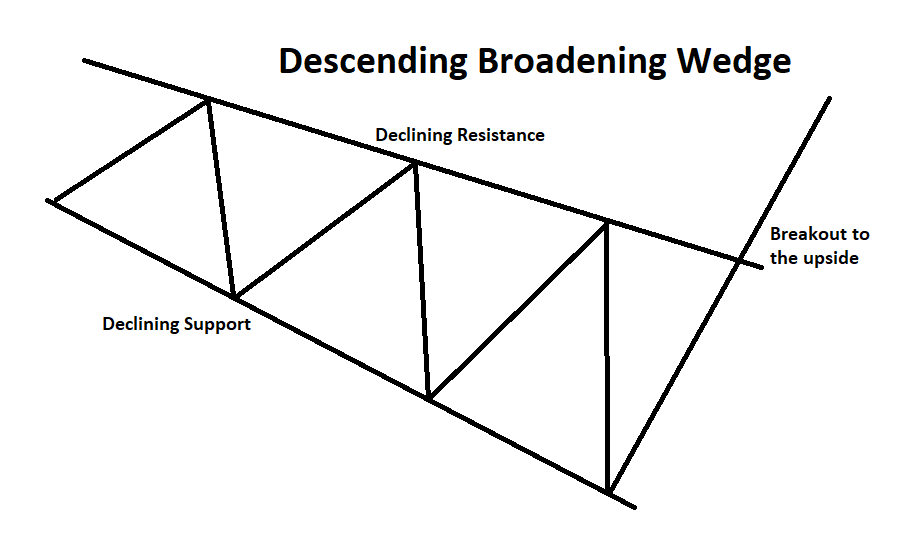
A descending broadening wedge chart pattern is a bullish reversal pattern. This pattern is created by two declining and diverging trend lines .
A descending broadening wedge forms as price moves between the upper resistance and lower support trend lines multiple times as the trading range expands during the downtrend in price. Price should touch each line 2 or 3 times to be considered a valid pattern. This pattern looks like a megaphone pointing down and to the right.
#TradeNotes#
면책 조항: 본 게시글에 표현된 견해는 전적으로 작성자의 견해이며 Followme의 공식 입장을 대변하지 않습니다. Followme는 제공된 정보의 정확성, 완전성 또는 신뢰성에 대해 책임을 지지 않으며, 서면으로 명시적으로 언급되지 않는 한 해당 내용을 기반으로 취해진 어떠한 조치에 대해서도 책임을 지지 않습니다.