


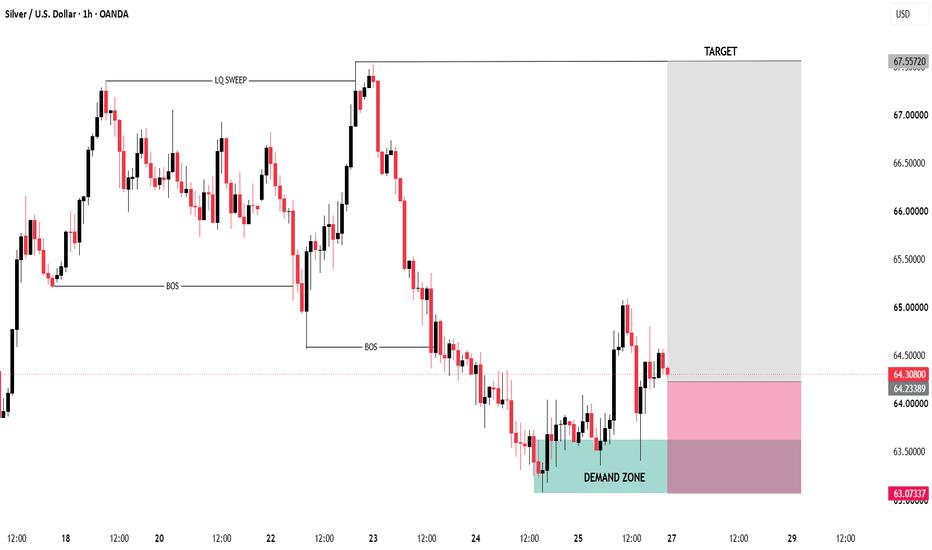
Silver is showing a clear bearish structure from the 67.50 area, with multiple lower highs and lower lows. However, the recent price action suggests a potential short-term structural recovery.
🔹 Price swept the previous liquidity around 67.30–67.50 before a strong bearish displacement.
🔹 The decline created successive BOS levels, confirming the prevailing bearish structure.
🔹 Price eventually reached the 63.30–63.60 demand zone, where selling pressure started to weaken.
🔹 From this zone, price produced a strong bullish reaction and pushed back toward 64.50–65.00.
🔹 Current price is consolidating around 64.30–64.50, so the reaction from the marked demand zone is the key area to observe.
🔹 A sustained break and close above the recent local high could strengthen the short-term bullish structure.
🔹 If the demand zone fails, the recent bullish recovery would be weakened and the broader bearish structure could regain control.
Key levels:
🟢 Demand: 63.30–63.60
⚪ Current structure: 64.30–64.50
🔺 Resistance / recent swing: 64.90–65.10
🔺 Major liquidity area: 67.30–67.50
📌 Educational focus: Liquidity sweep → displacement → BOS → demand-zone reaction → structure confirmation
면책 조항: 본 게시글에 표현된 견해는 전적으로 작성자의 견해이며 Followme의 공식 입장을 대변하지 않습니다. Followme는 제공된 정보의 정확성, 완전성 또는 신뢰성에 대해 책임을 지지 않으며, 서면으로 명시적으로 언급되지 않는 한 해당 내용을 기반으로 취해진 어떠한 조치에 대해서도 책임을 지지 않습니다.

