


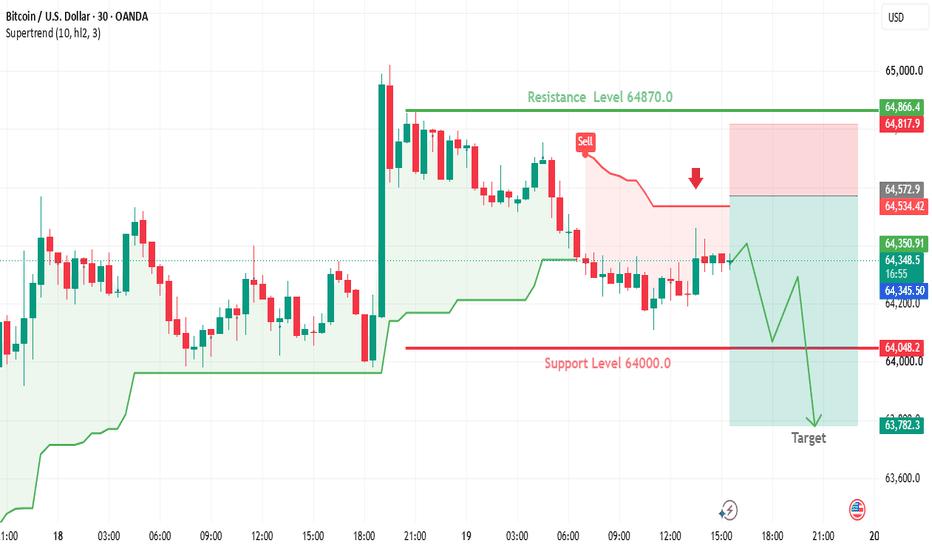
Chart Analysis (30-Minute Time Frame)
The chart shows Bitcoin (BTC/USD) trading around $64,361, with the market moving inside a short-term consolidation phase after failing to maintain momentum above the recent highs.
Key Technical Levels
Resistance: $64,870
Sell Zone: $64,572
Support: $64,000
Bearish Target: $63,782
Bearish Signals
The chart highlights a sell setup near $64,572, suggesting that sellers are defending this area.
Bitcoin failed to retest the $64,870 resistance level, indicating weakening bullish momentum.
The Supertrend indicator remains above the current market price, reinforcing the bearish outlook.
Recent candles show a series of lower highs, which often signals increasing selling pressure.
Trading Scenario
If BTC remains below $64,572, the bearish scenario could continue.
Rejection from the sell zone may push the price toward $64,000.
A breakdown below $64,000 could accelerate selling.
The next projected target is $63,782.
Invalidation Scenario
A sustained move above $64,870 would invalidate this bearish setup and could shift momentum back in favor of buyers.
면책 조항: 본 게시글에 표현된 견해는 전적으로 작성자의 견해이며 Followme의 공식 입장을 대변하지 않습니다. Followme는 제공된 정보의 정확성, 완전성 또는 신뢰성에 대해 책임을 지지 않으며, 서면으로 명시적으로 언급되지 않는 한 해당 내용을 기반으로 취해진 어떠한 조치에 대해서도 책임을 지지 않습니다.

