


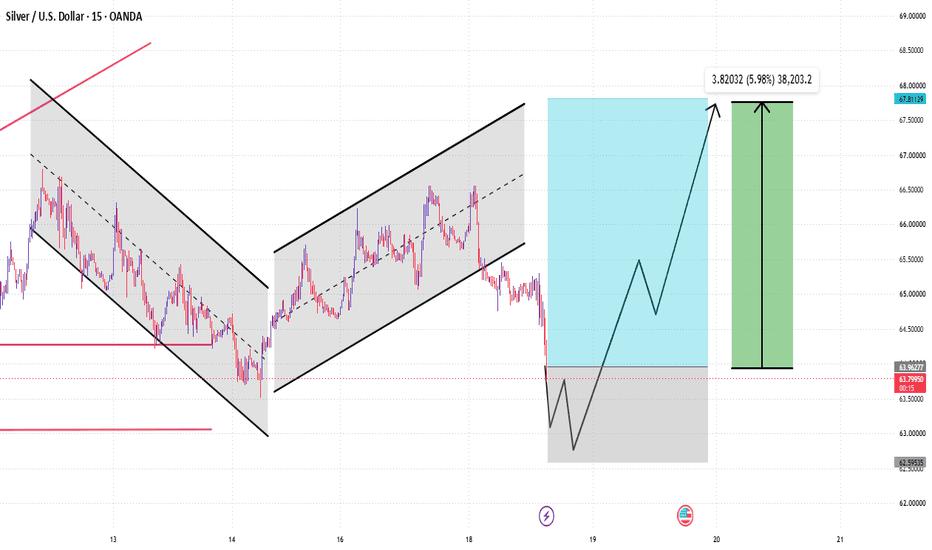
Silver has developed an interesting multi-stage structure on the 15-minute chart. The earlier price action formed a declining channel, followed by a recovery into a rising channel.
The rising channel carried price toward the 66.40–66.50 region. From there, price started a strong correction and has now moved back toward the lower support levels.
With current price near 63.939, the 63.40 area is the first major reference point shown on the chart.
Phase 1 — Current Pullback
The immediate levels are:
63.40 — First support
63.00 — Important support
62.80 — Lower reference area
The projected path suggests that price could potentially test the 63.00–62.80 region before attempting a larger recovery.
Phase 2 — Recovery Levels
If price stabilizes and begins forming higher lows, the next areas on the chart are:
64.50
65.50
67.00
67.50–67.70
Full Chart Roadmap:
63.939 → 63.40 → 63.00 → 62.80
Possible recovery path:
62.80 → 64.50 → 65.50 → 67.00 → 67.50–67.70
Main Observation:
The 63.40–63.00 region is the key area to observe in the current structure. If price stabilizes there and starts creating higher lows, the recovery levels shown on the chart become relevant. A sustained move below 62.80 would invalidate the projected recovery structure and require a fresh assessment.
면책 조항: 본 게시글에 표현된 견해는 전적으로 작성자의 견해이며 Followme의 공식 입장을 대변하지 않습니다. Followme는 제공된 정보의 정확성, 완전성 또는 신뢰성에 대해 책임을 지지 않으며, 서면으로 명시적으로 언급되지 않는 한 해당 내용을 기반으로 취해진 어떠한 조치에 대해서도 책임을 지지 않습니다.

