


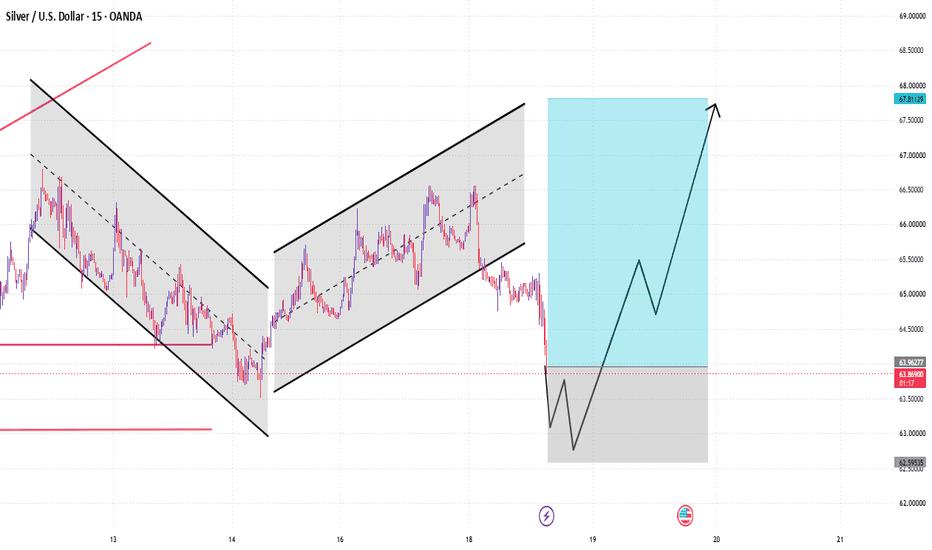
The 15-minute Silver chart shows a transition from a declining channel into a rising channel. Price later reached the upper part of the recovery structure near 66.50, followed by a sharp correction.
Current price is around 63.939, and the recent move has brought price back toward the marked support region.
Important Areas:
63.40 — First support
63.00 — Important lower support
62.80 — Deeper reference area
If price finds stability in this region, the chart projection shows possible recovery levels:
64.50 → 65.50 → 67.00 → 67.50–67.70
Structure to Watch:
Current: 63.94
⬇ 63.40
⬇ 63.00
⬇ 62.80
⬆ 64.50
⬆ 65.50
⬆ 67.00
⬆ 67.50–67.70
A sustained move below the lower support area would weaken the recovery scenario, while a return above 64.50 would indicate improving short-term structure.
면책 조항: 본 게시글에 표현된 견해는 전적으로 작성자의 견해이며 Followme의 공식 입장을 대변하지 않습니다. Followme는 제공된 정보의 정확성, 완전성 또는 신뢰성에 대해 책임을 지지 않으며, 서면으로 명시적으로 언급되지 않는 한 해당 내용을 기반으로 취해진 어떠한 조치에 대해서도 책임을 지지 않습니다.

