


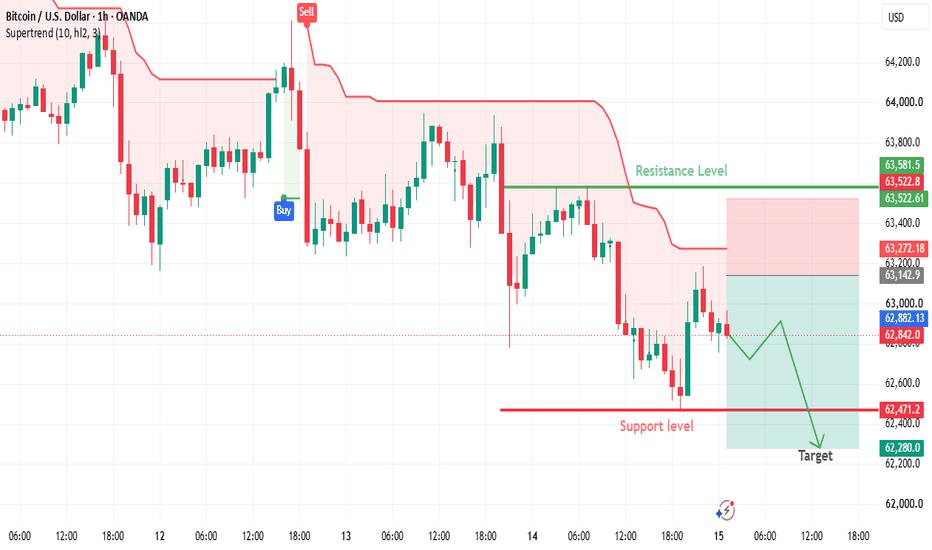
Timeframe: 1-Hour (BTC/USD)
The chart shows that Bitcoin remains in a short-term bearish trend. Price action is trading below the Supertrend indicator, suggesting that sellers still control the market.
Key Levels
Resistance: 63,522
Support: 62,471
Current Price: 62,842
Target: 62,280
Chart Analysis
The red Supertrend line above the candles confirms a bearish market structure.
Bitcoin attempted a recovery from the 62,000–62,200 area, but the rebound lacked strong bullish momentum.
The price remains trapped below the 63,522 resistance zone, which is acting as a major barrier.
Several recent candles show rejection near 63,000, indicating that buyers are struggling to push the market higher.
Bearish Scenario
If Bitcoin fails to break above 63,522, the market could:
Retest the 62,471 support level.
Break below support.
Continue declining toward the 62,280 target.
Bullish Scenario
A bullish reversal would require:
A strong breakout above 63,522.
Increased buying volume.
The price closing above the Supertrend indicator.
Trading Outlook
Level Price
Resistance 63,522
Current Price 62,842
Support 62,471
Bearish Target 62,280
면책 조항: 본 게시글에 표현된 견해는 전적으로 작성자의 견해이며 Followme의 공식 입장을 대변하지 않습니다. Followme는 제공된 정보의 정확성, 완전성 또는 신뢰성에 대해 책임을 지지 않으며, 서면으로 명시적으로 언급되지 않는 한 해당 내용을 기반으로 취해진 어떠한 조치에 대해서도 책임을 지지 않습니다.

