


1. Trend Overview
Short-term trend: Strongly Bullish
Key signals:
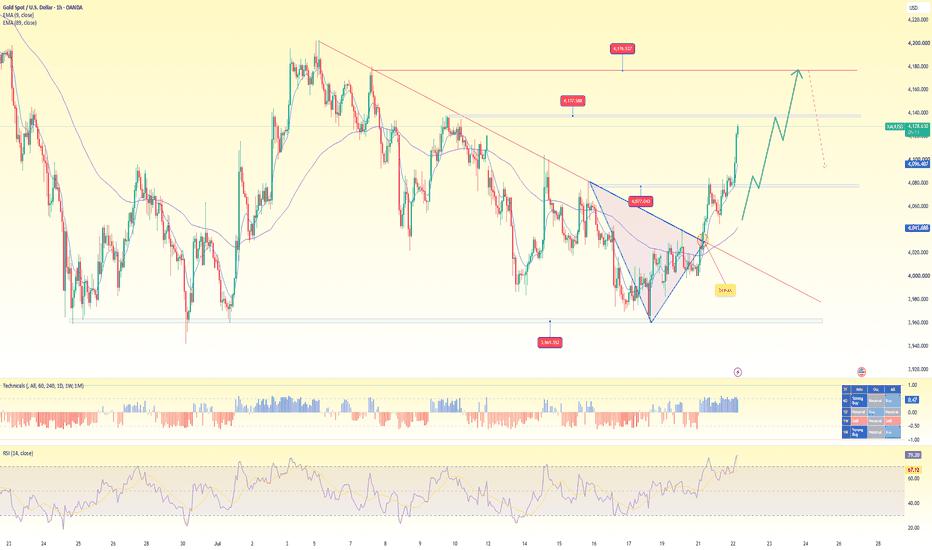
Price has broken above the descending trendline that had been in place since the beginning of the month.
It has also broken out of a descending triangle / falling wedge pattern (the circled area on the chart).
EMA 9 = 4,096 is positioned above EMA 89 = 4,041, confirming bullish momentum.
RSI (14) = 79, indicating that the market is very strong but has also entered the overbought zone.
👉 Conclusion: Buyers are currently in control of the H1 trend. However, after such a steep rally, the probability of a technical pullback is relatively high before the uptrend continues.
2. Current Outlook
Gold is currently in a strong bullish phase following the breakout of a bearish structure. The higher-probability scenario is a short-term pullback toward 4,080, followed by a continuation move toward 4,176.
The current bullish structure would only be invalidated if an H1 candle closes below 4,020.
3. Resistance Levels
Immediate resistance: 4,137 – 4,140
Major resistance: 4,176 – 4,180
4. Support Levels
Immediate support: 4,077 – 4,080
Dynamic support: EMA 89 around 4,041 – 4,045
Strong demand zone: 4,020 – 4,030
--------------
SELL GOLD zone : 4176 - 4179
SL : 4184
TP : 4160 - 4132 - 4105
----------------
면책 조항: 본 게시글에 표현된 견해는 전적으로 작성자의 견해이며 Followme의 공식 입장을 대변하지 않습니다. Followme는 제공된 정보의 정확성, 완전성 또는 신뢰성에 대해 책임을 지지 않으며, 서면으로 명시적으로 언급되지 않는 한 해당 내용을 기반으로 취해진 어떠한 조치에 대해서도 책임을 지지 않습니다.

