


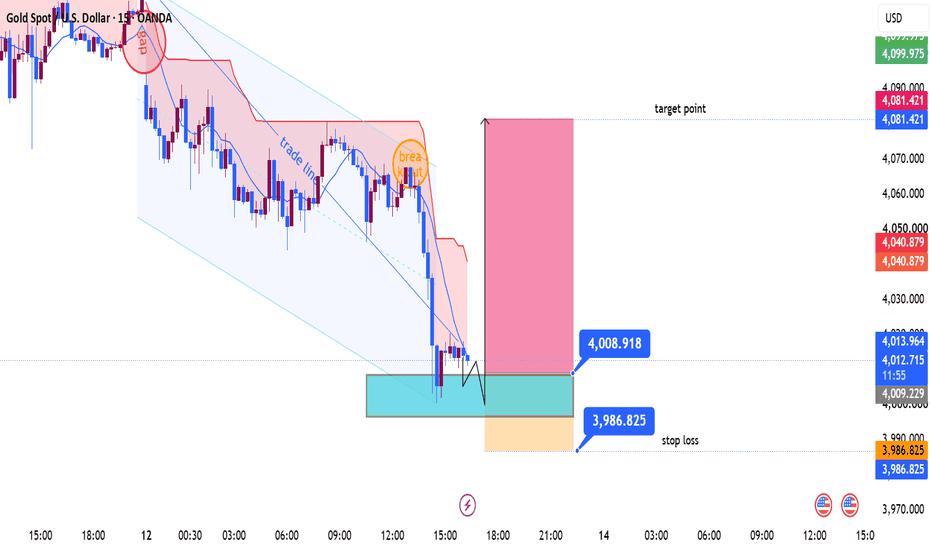
This XAU/USD 15-minute chart shows a clear bearish trend channel, followed by a sharp selloff into a demand/liquidity zone. The trade idea on the chart is a counter-trend long (buy-the-dip) from support.
Market Structure
Bearish trend channel
Active
Price respected the descending channel for most of the session.
Breakout
Momentum
The circled “breakout” area failed to hold, and sellers regained control immediately.
Momentum move
Strong selloff
A strong impulsive drop broke below short-term structure.
Demand zone
Key area
Price is now sitting inside the highlighted blue demand zone around 4000–4010.
Liquidity & Key Levels
Demand / support
Buy zone
4000–4010
This is the main liquidity pool where buyers have reacted.
First resistance
Reclaim
4040–4045
Previous intraday support turned resistance.
Major target
TP zone
4081.4
The chart’s projected target aligns with the top of the recent range.
Trade Setup on the Chart
Entry
4008.9
Stop loss
3986.8
Below the demand zone
Target
4081.4
Projected rebound target
Risk-to-reward
~3.3R
Favorable
Risk ≈ 22 points · Reward ≈ 72 points
What the Price Action Suggests
Bullish scenario
Hold above 4000.
Form a higher low inside the blue zone.
Break back above 4015–4020.
Then a squeeze toward 4040 and potentially 4080 becomes likely.
Bearish invalidation
A decisive close below 3990.
Follow-through selling beneath the demand zone.
That would invalidate the long idea and expose 3970–3960 next.
ICT Perspective
This setup resembles an ICT sell-side liquidity sweep:
Price aggressively raids liquidity below prior intraday lows.
The move enters a higher-timeframe demand area.
The projected rebound aims to rebalance the inefficiency created by the impulsive drop.
The key confirmation is not the touch of the zone, but whether price can reclaim 4015–4020 after the sweep.
면책 조항: 본 게시글에 표현된 견해는 전적으로 작성자의 견해이며 Followme의 공식 입장을 대변하지 않습니다. Followme는 제공된 정보의 정확성, 완전성 또는 신뢰성에 대해 책임을 지지 않으며, 서면으로 명시적으로 언급되지 않는 한 해당 내용을 기반으로 취해진 어떠한 조치에 대해서도 책임을 지지 않습니다.

