


SMC Trading point update
Chart Overview
• Pair: Gold Spot / USD - 1 Hour timeframe
• Current price: $4,062.43
• Date: Jul 13, 2026 07:25 UTC-5
• Bias on chart: Bullish pullback → continuation up
Key Levels Marked
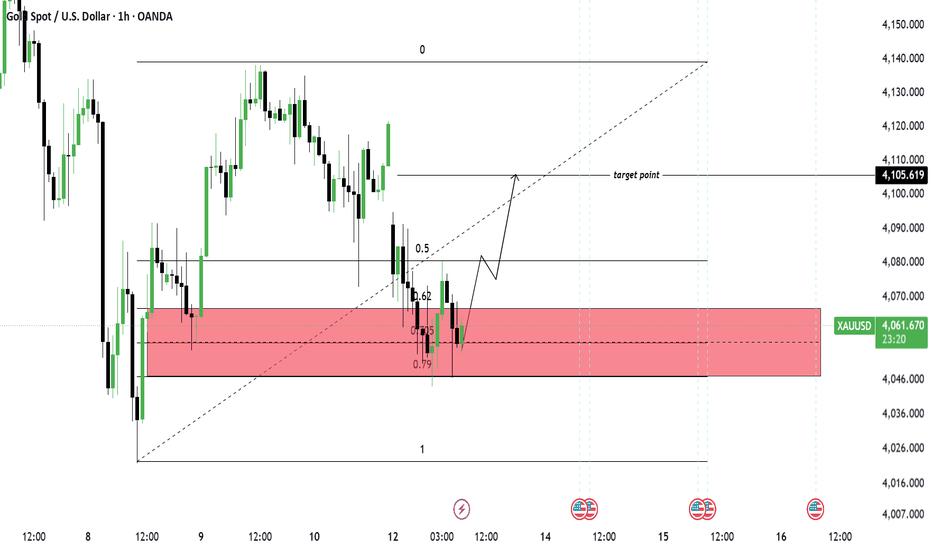
1. Major Demand Zone - RED BOX: $4,046 - $4,066
Price just wicked into the 0.705 - 0.79 fib area inside this zone and bounced. This is strong confluence: fib + horizontal demand + diagonal trendline support.
2. Fib Retracement: Drawn from swing low to swing high
• 0.5: $4,080
• 0.62: $4,070
• 0.705 - 0.79: Inside the red demand box
• 0: $4,140
3. Target Point: $4,105.61
This lines up just under the previous 1H supply and the diagonal resistance.
Me SMC trading point
4. Diagonal Trendline: Rising support from the swing low. Price tapped it and reacted up.
The Idea on the Chart
The arrow shows the expected move:
1. Buy from demand: Reaction off $4,046 - $4,066 zone + trendline
2. First Target: $4,080 - 0.5 fib
3. Main Target: $4,105 - Previous 1H supply / "target point"
This is a classic SMC "buy in discount" setup. Price came to demand, took liquidity below, and is now pushing up.
dipcrschn Signal Format
• Bias: Bullish above $4,046
• Buy Zone: $4,050 - $4,065
• SL: Below $4,040 - under the zone + structure
• TP1: $4,080
• TP2: $4,105
• Invalidation: 1H close below $4,046 flips bias bearish
Please boost this analysis
면책 조항: 본 게시글에 표현된 견해는 전적으로 작성자의 견해이며 Followme의 공식 입장을 대변하지 않습니다. Followme는 제공된 정보의 정확성, 완전성 또는 신뢰성에 대해 책임을 지지 않으며, 서면으로 명시적으로 언급되지 않는 한 해당 내용을 기반으로 취해진 어떠한 조치에 대해서도 책임을 지지 않습니다.

