


XAU/USD (Gold) 15-Minute Technical Analysis
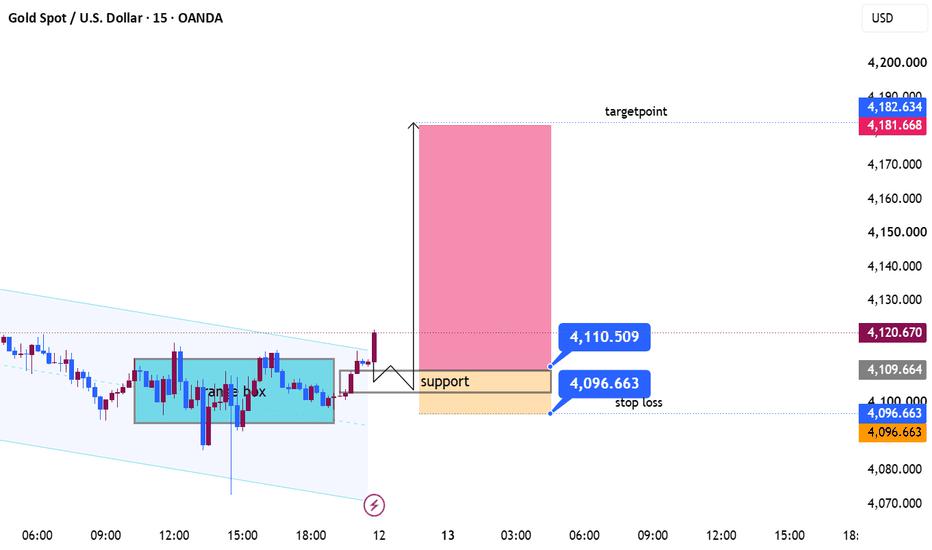
The chart shows gold breaking above a consolidation range (range box) and attempting to confirm a bullish continuation. Price has also pushed above the descending trendline, indicating buyers are gaining control.
Market Structure
Trend: Short-term bullish.
Breakout: Price has broken above the range resistance around 4109–4111, signaling a potential continuation move.
Retest Zone: The highlighted support area (4109–4097) is the key demand zone. A successful retest here would strengthen the bullish setup.
Key Levels
Immediate Resistance: 4121–4125 (current swing high area).
Support: 4109.5 (breakout level).
Major Support / Stop Loss: 4096.6 (below the demand zone).
Bullish Target: 4181.7, which aligns with the projected measured move shown on the chart.
Liquidity Analysis
Buy-side Liquidity: Above 4121. If price clears this high, it could trigger stop orders from sellers and accelerate toward higher levels.
Sell-side Liquidity: Around 4097–4100. A dip into this zone may sweep liquidity before buyers step back in.
Trading Scenario
Bullish Case (Preferred)
Wait for a pullback into 4109–4100.
Watch for bullish confirmation (strong rejection candle, bullish engulfing, or higher low).
Entry: Near 4109–4105 after confirmation.
Stop Loss: 4096.6.
Targets:
TP1: 4125
TP2: 4150
TP3: 4181.7
Bearish Invalidation
A sustained close below 4096.6 would invalidate the breakout and increase the probability of a move back into the previous range around 4085–4075.
Overall Bias
The technical structure favors bullish continuation as long as price remains above the 4096.6 support. A healthy retest of the breakout zone could offer a higher-probability long opportunity, while a decisive break below support would shift momentum back to the bears.
면책 조항: 본 게시글에 표현된 견해는 전적으로 작성자의 견해이며 Followme의 공식 입장을 대변하지 않습니다. Followme는 제공된 정보의 정확성, 완전성 또는 신뢰성에 대해 책임을 지지 않으며, 서면으로 명시적으로 언급되지 않는 한 해당 내용을 기반으로 취해진 어떠한 조치에 대해서도 책임을 지지 않습니다.

