


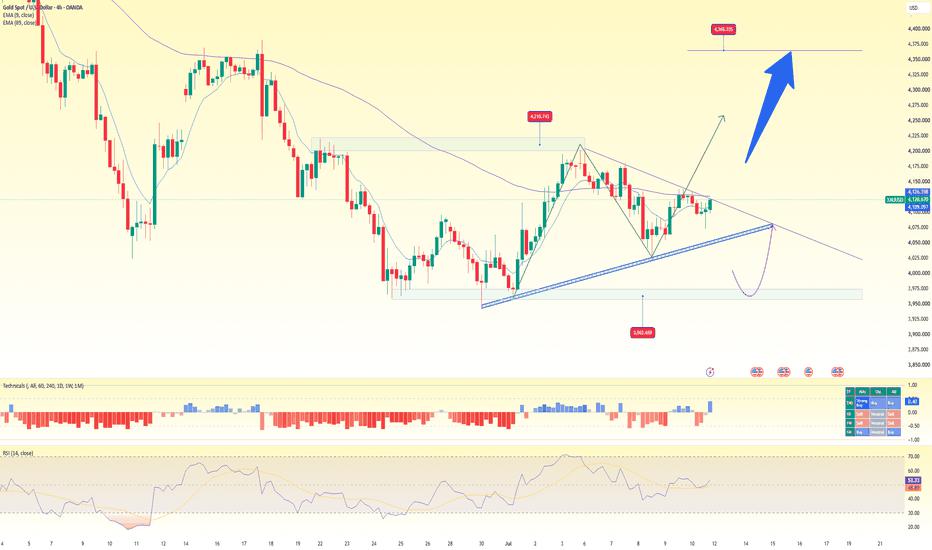
1. Current Trend
Medium-term trend: Shifting from bearish to consolidation with a bullish bias.
Price is forming a Higher Low while holding above the ascending trendline.
It is currently testing the confluence of the ascending trendline and the H4 EMA89, a key area that will likely determine the next directional move.
2. Key Resistance
Resistance 1: 4,126–4,130
H4 EMA89.
Short-term dynamic resistance.
A close above this zone would confirm a bullish breakout.
Resistance 2: 4,210–4,215
Strong supply zone.
Recent swing high.
A breakout above this area would strengthen the bullish trend.
Major Resistance: 4,345–4,350
Next bullish target.
Major long-term resistance and key swing high.
3. Key Support
Near Support: 4,075–4,085
Ascending trendline.
Confluence with the recent Higher Low.
Holding above this zone keeps the bullish structure intact.
Major Support: 3,962–3,975
H4 demand zone.
Strong support for the current uptrend.
A break below this area would signal a bearish trend reversal.
4. EMA
EMA9 has crossed above and is trading around the EMA89.
EMA89 is still sloping downward but has started to flatten.
Price is testing the EMA89, and a close above it would provide a bullish confirmation.
5. RSI (14)
RSI is around 53.
Momentum is improving and remains above the 50 level.
RSI is not yet overbought, suggesting there is still room for further upside if price breaks above resistance.
면책 조항: 본 게시글에 표현된 견해는 전적으로 작성자의 견해이며 Followme의 공식 입장을 대변하지 않습니다. Followme는 제공된 정보의 정확성, 완전성 또는 신뢰성에 대해 책임을 지지 않으며, 서면으로 명시적으로 언급되지 않는 한 해당 내용을 기반으로 취해진 어떠한 조치에 대해서도 책임을 지지 않습니다.

