


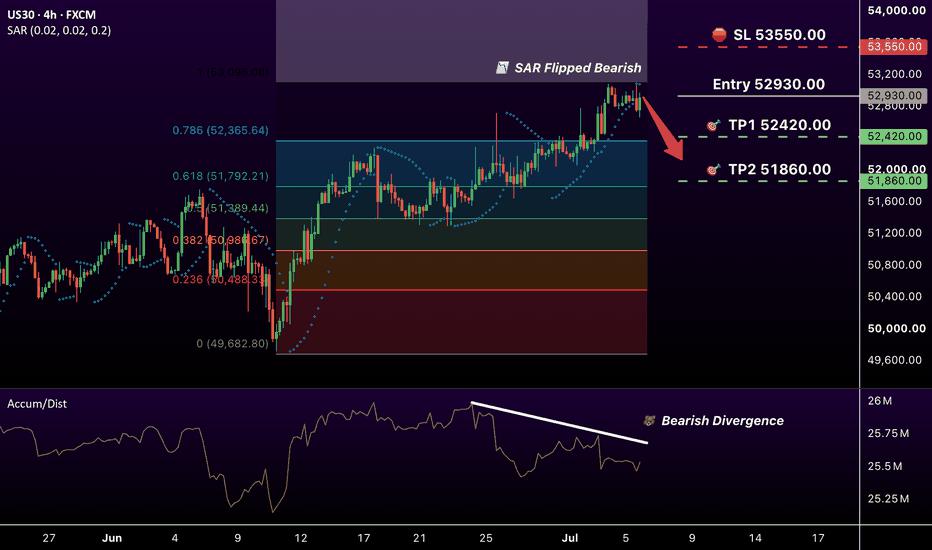
📊 Trade Plan:
🔻 Entry: 52930
🛑 Stop Loss: 53550
🎯 Take Profit 1: 52420 (above 0.786 Fib)
🎯 Take Profit 2: 51860 (above 0.618 Fib)
📉 Technical Picture (H4 & Daily):
Parabolic SAR: Dots have flipped above price. Trend signal turned bearish.
Accumulation/Distribution: Divergence — price making higher highs, A/D making lower highs. Smart money distributing, not accumulating.
Fibonacci: Grid drawn from swing low to swing high. TP1 sits just above the 0.786 level, TP2 just above 0.618.
🗞️ Fundamental Note:
Dow futures are climbing after weak NFP data tempered September rate hike expectations — now at 45%, down from 48.3% a week ago. The Dow rallied nearly 2% last week to fresh records, driven by defensive sectors. But FOMC Minutes Wednesday could shift the narrative.
❌ Invalidation:
A daily close above 53550 invalidates the Parabolic SAR flip and voids the short setup.
면책 조항: 본 게시글에 표현된 견해는 전적으로 작성자의 견해이며 Followme의 공식 입장을 대변하지 않습니다. Followme는 제공된 정보의 정확성, 완전성 또는 신뢰성에 대해 책임을 지지 않으며, 서면으로 명시적으로 언급되지 않는 한 해당 내용을 기반으로 취해진 어떠한 조치에 대해서도 책임을 지지 않습니다.

