📊 Trade Plan:
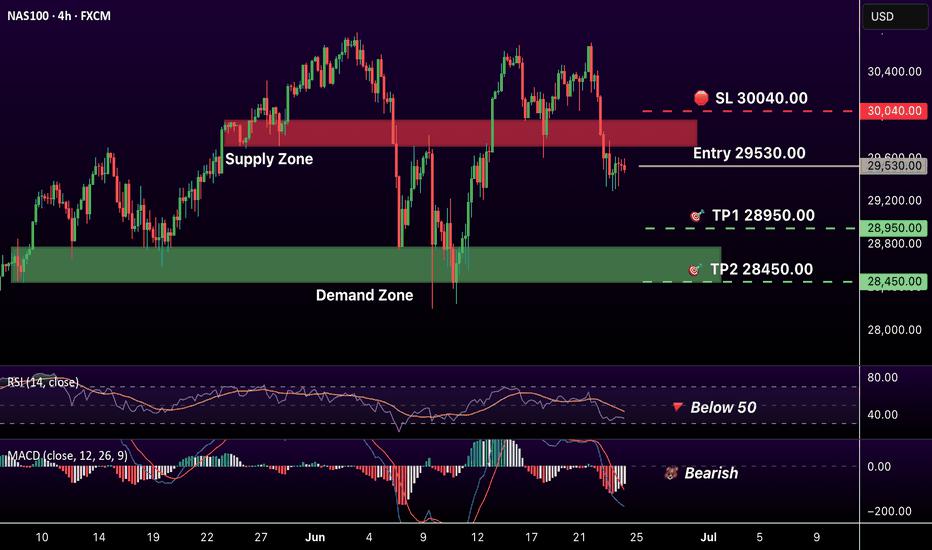
🔻 Entry: 29530
🛑 Stop Loss: 30040 (above supply zone)
🎯 Take Profit 1: 28950
🎯 Take Profit 2: 28450 (inside demand zone)
📉 Technical Picture (H4 & Daily):
Supply Zone: Price broke below the 29720–29950 supply zone. Sellers took control — now looking for continuation lower.
RSI: Signal lines crossed below 50 and are pointing down. Bearish momentum intact.
MACD: Lines are sloping down. Histogram shows a brief correction, but the broader move remains bearish.
Demand Zone Below: The 28450–28770 area is the next buyer zone. This is where TP2 sits.
🗞️ Fundamental Note:
Tech stocks are under heavy pressure. The NASDAQ 100 dropped on Tuesday, dragged by a 10%+ sell-off in Micron and Sandisk following SK Hynix's slowdown in AI memory chip expansion. Nvidia fell another 3% as B200 rental prices dropped 31% since late May. Broader risk appetite is fading — hawkish Fed expectations and weak ETF flows across crypto are adding to the downside mood in equities.
❌ Invalidation:
A daily close above 30040 reclaims the supply zone and voids the short setup.
면책 조항: 본 게시글에 표현된 견해는 전적으로 작성자의 견해이며 Followme의 공식 입장을 대변하지 않습니다. Followme는 제공된 정보의 정확성, 완전성 또는 신뢰성에 대해 책임을 지지 않으며, 서면으로 명시적으로 언급되지 않는 한 해당 내용을 기반으로 취해진 어떠한 조치에 대해서도 책임을 지지 않습니다.

더 오래된 의견은 없습니다. 소파를 가장 먼저 잡으십시오.