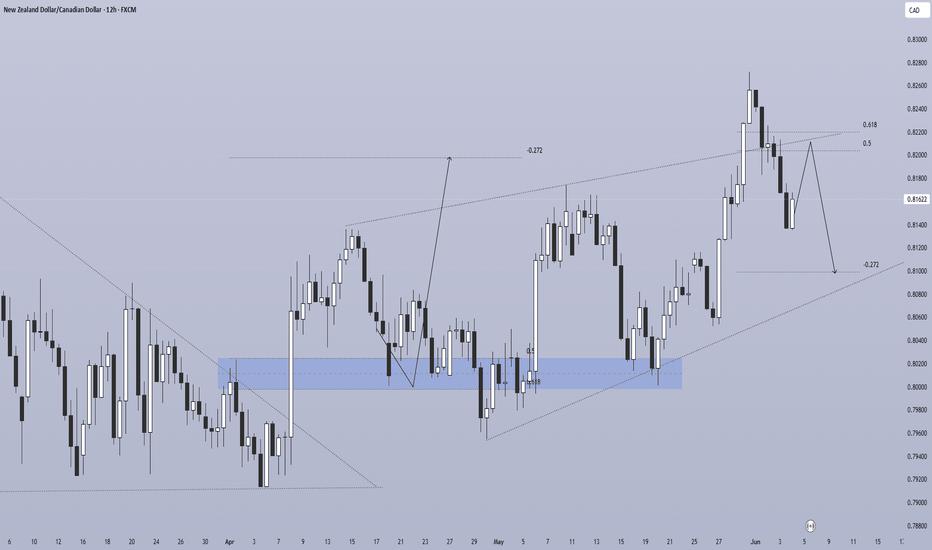
Market Structure
Descending channel from March broke upward in late April
Strong rally from 0.618 fib demand zone (0.8000–0.8020) — reacted twice
Price peaked at 0.8260 (June 1) — now pulling back
Pullback to 0.5–0.618 fib (~0.8180–0.8220) forming
Projected Scenario
🔴 Bearish short-term:
Rejection from current level
Dip to -0.272 ext. (~0.8100) — minor target
Potential retest of 0.618 fib zone (0.8000–0.8020)
🟢 Bullish medium-term:
Bounce from -0.272 / 0.618 zone
Continuation rally targeting -0.272 upper ext. (~0.8200+)
Pattern mirrors the April–May bounce structure
Bias Summary
Short-term: 🔴 Mild bearish — pullback to 0.8100–0.8020
Medium-term: 🟢 Bullish — bounce targets 0.8200+
Invalidation: Break below 0.7980 flips bias bearish
면책 조항: 본 게시글에 표현된 견해는 전적으로 작성자의 견해이며 Followme의 공식 입장을 대변하지 않습니다. Followme는 제공된 정보의 정확성, 완전성 또는 신뢰성에 대해 책임을 지지 않으며, 서면으로 명시적으로 언급되지 않는 한 해당 내용을 기반으로 취해진 어떠한 조치에 대해서도 책임을 지지 않습니다.

더 오래된 의견은 없습니다. 소파를 가장 먼저 잡으십시오.