- AUD/NZD in on the verge of completing seven consecutive weeks of uninterrupted bullish closes.
- Bears are wathing the 4-hour chart like a hawk.
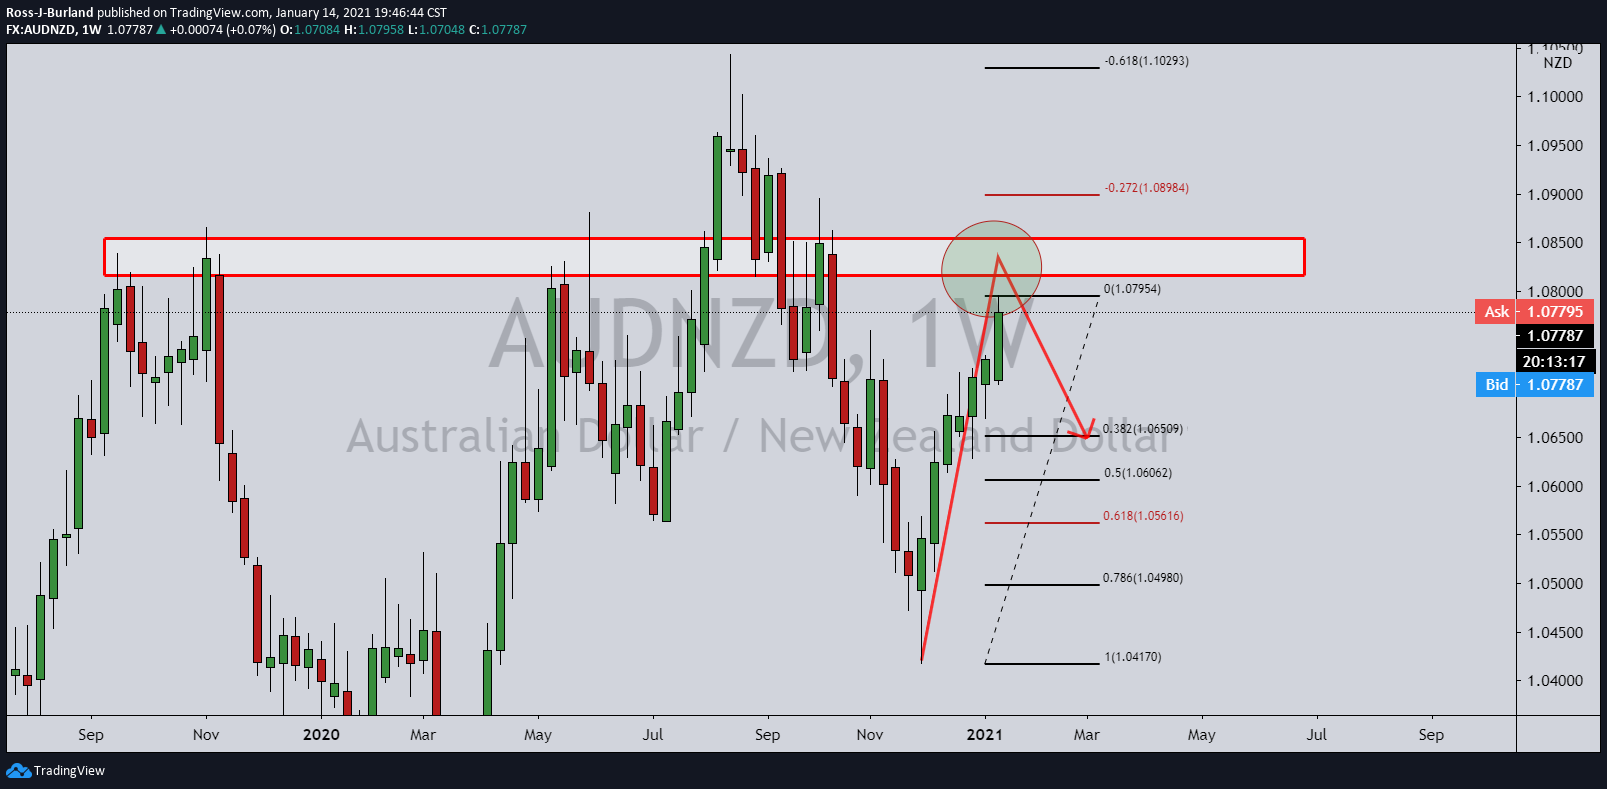
Further to the prior analysis, AUD/NZD Price Analysis: Bears target a 38.2% Fibo retracement, the bulls have still not given anything back in an uninterrupted series of higher closes on a weekly basis.
With just 20 hours to go until this weeks close, the pair is on track to complete its 7th higher closing week in a row. Something has got to give.
However, there is little on the charts, at least in terms of technical indicators, to say that this rally is about to correct anytime soon.
All of the technicals remain bullish from the monthly down to the 4-hour chart.
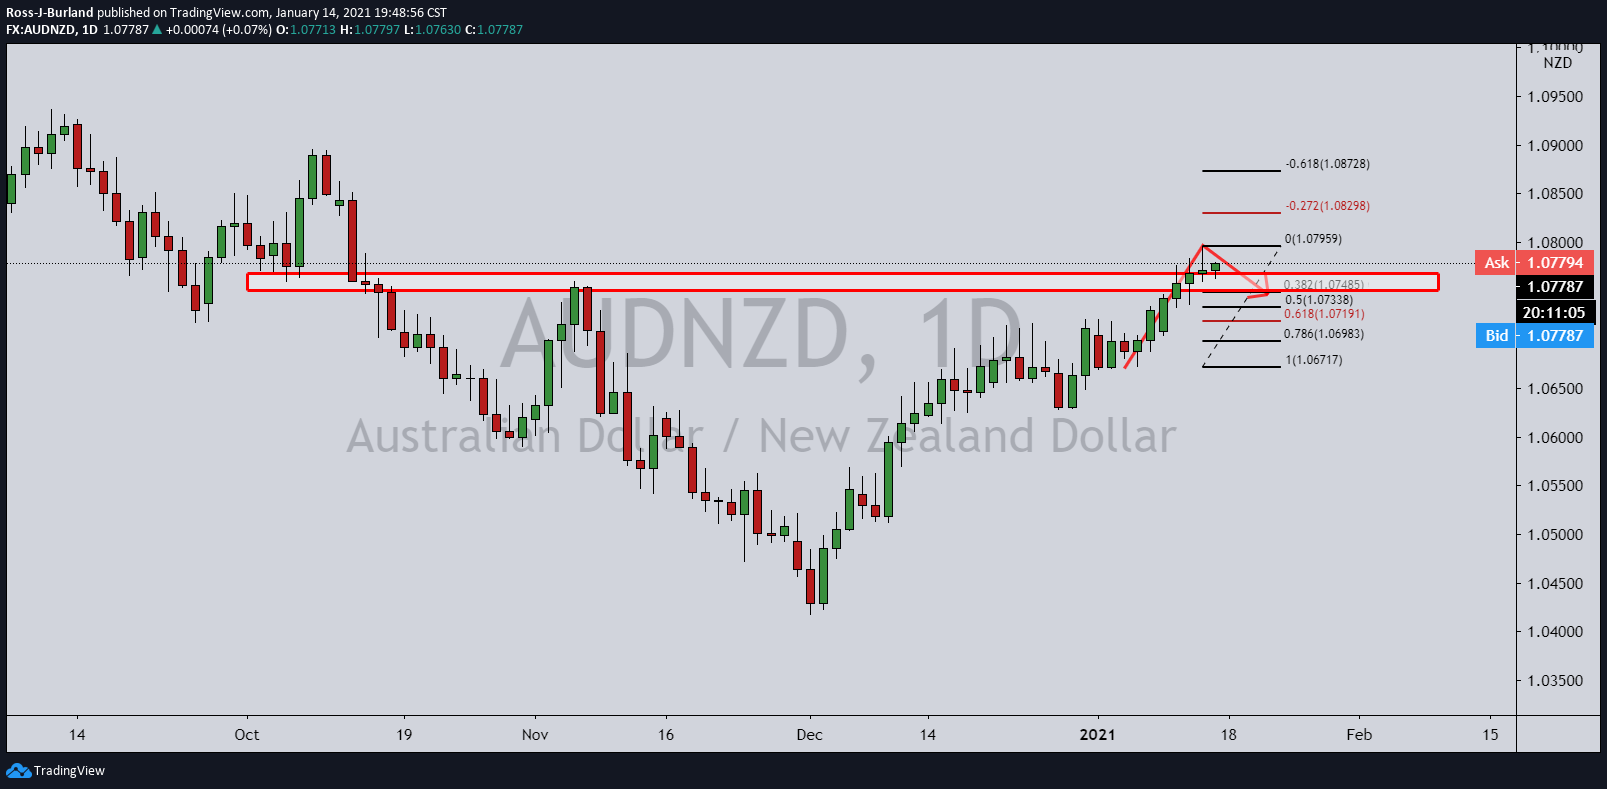
Daily chart
4-hour M-formation
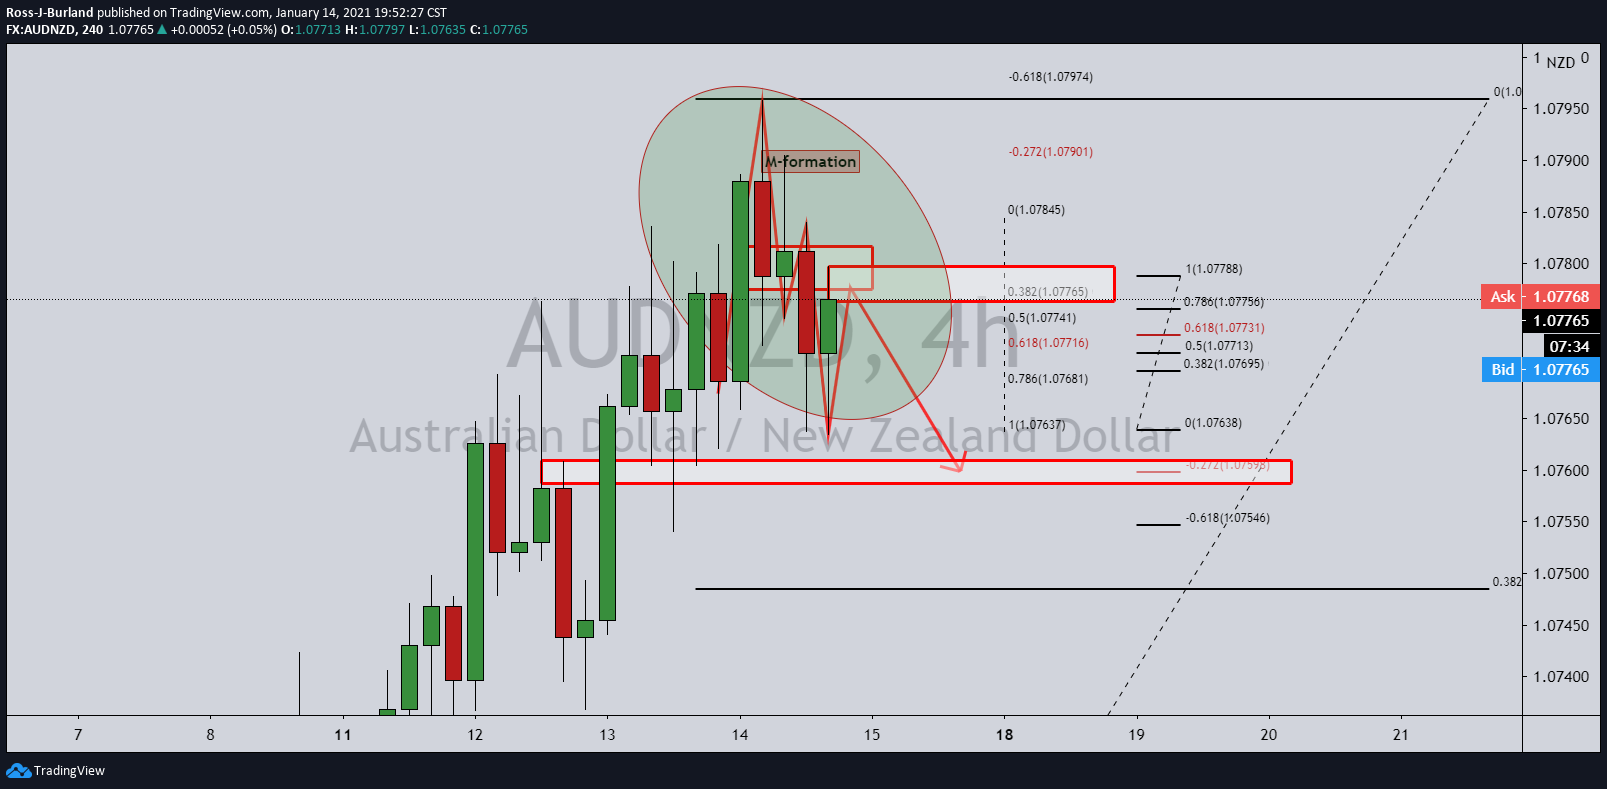
However, with the price completing an M-formation, the market would be expected to resist at this juncture and melt to the downside.
Could this be a turning point?
While the weekly target is located down in a 38.2% Fib retracement of the weekly impulse, the first stop meets the prior structure and a -0.272% Fibo of the recent correction to the W-formation's neckline and resistance.
원저자가 모두 저작권을 보유한 FXStreet에서 재 인쇄 함.
면책 조항: 본 게시글에 표현된 견해는 전적으로 작성자의 견해이며 Followme의 공식 입장을 대변하지 않습니다. Followme는 제공된 정보의 정확성, 완전성 또는 신뢰성에 대해 책임을 지지 않으며, 서면으로 명시적으로 언급되지 않는 한 해당 내용을 기반으로 취해진 어떠한 조치에 대해서도 책임을 지지 않습니다.

더 오래된 의견은 없습니다. 소파를 가장 먼저 잡으십시오.