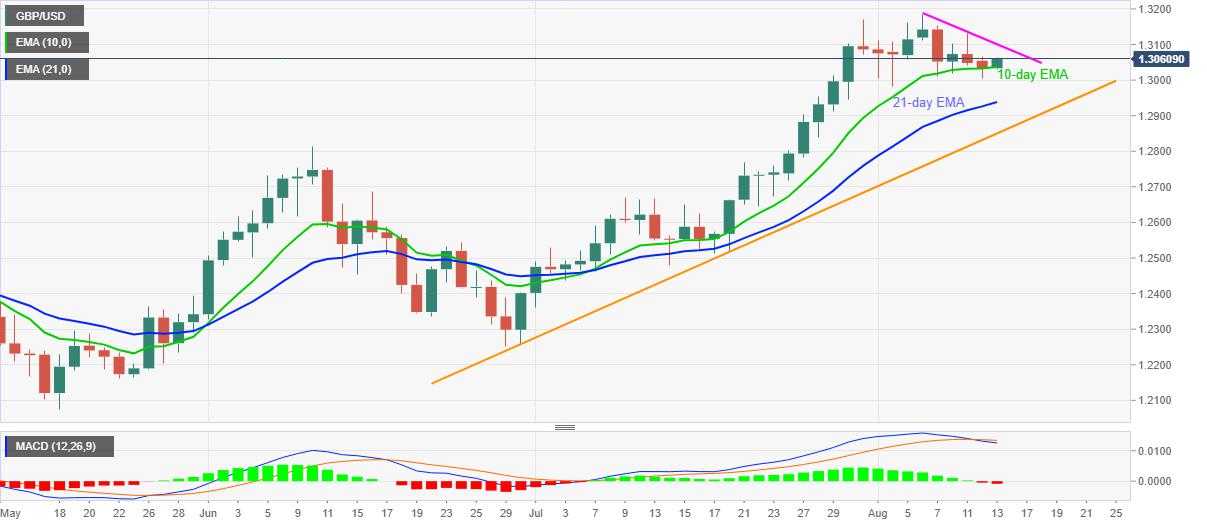
- GBP/USD extends recovery gains from 1.3020 while snapping a two-day losing streak.
- Bearish MACD, one-week-old faling trend line doubts the pair’s further upside.
- 21-day EMA, a six-week-old support line add to the downside support.
GBP/USD recovers from 10-day EMA while trading near 1.3057, up 0.18% on a day, during the early Thursday’s Asian session. The Cable’s latest bounce ignores bearish MACD signals while aiming for a short-term resistance line.
However, the pair’s further upside beyond the said trend line resistance, at 1.3100 now, will need a strong push before attacking the monthly top around 1.3185 and March month’s peak surrounding 1.3200.
In a case where the bulls dominate past-1.3200, December 31, 2019 high close to 1.3285 can return to the chart.
Meanwhile, a downside break of 10-day EMA level of 1.3035 won’t call the bears immediately as 21-day EMA and an ascending trend line from June 30, respectively around 1.2935 and 1.2850, can still trigger the pair’s bounce.
GBP/USD daily chart
Trend: Bullish
원저자가 모두 저작권을 보유한 FXStreet에서 재 인쇄 함.
면책 조항: 본 게시글에 표현된 견해는 전적으로 작성자의 견해이며 Followme의 공식 입장을 대변하지 않습니다. Followme는 제공된 정보의 정확성, 완전성 또는 신뢰성에 대해 책임을 지지 않으며, 서면으로 명시적으로 언급되지 않는 한 해당 내용을 기반으로 취해진 어떠한 조치에 대해서도 책임을 지지 않습니다.

더 오래된 의견은 없습니다. 소파를 가장 먼저 잡으십시오.