- GBP/USD remains redundant between 1.2455/75 area following its U-turn from 1.2530.
- A bearish candlestick formation below 21-day SMA increases the odds of the pair’s further weakness.
- Bulls may seek validation from June 24 top before entry.
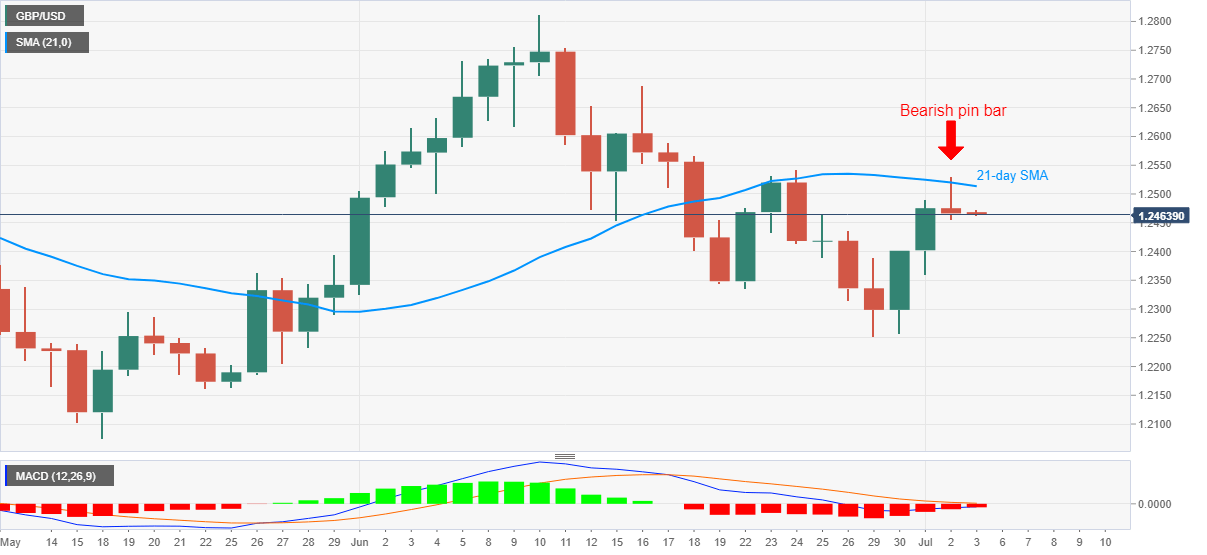
GBP/USD takes rounds to 1.2470 amid Friday’s Asian session. The Cable turned south from over one-week top the previous day, which in turn portrayed a bearish pin bar candlestick formation on the daily chart. Also favoring the sellers is the pair’s sustained trading below 21-day SMA and MACD signals.
Hence, the quote is likely to revisit June 29 top surrounding 1.2390 during the fresh downside. However, the last month’s low close to 1.2252 could restrict further weakness.
Given the GBP/USD prices fail to recover from 1.2252, May 22 low of 1.2162 might offer an intermediate halt before dragging the quote towards May 18 bottom around 1.2075 and 1.2000 threshold.
On the contrary, the pair’s upside break of 21-day SMA level of 1.2514 won’t immediately call the bulls as June 24 high close to 1.2545 will become additional resistance to watch.
Though, the pair’s further rise past-1.2545 might not hesitate to challenge the June monthly top of 1.2813 with June 16 peak around 1.2690 likely being an intermediate halt.
GBP/USD daily chart
Trend: Pullback expected
원저자가 모두 저작권을 보유한 FXStreet에서 재 인쇄 함.
면책 조항: 본 게시글에 표현된 견해는 전적으로 작성자의 견해이며 Followme의 공식 입장을 대변하지 않습니다. Followme는 제공된 정보의 정확성, 완전성 또는 신뢰성에 대해 책임을 지지 않으며, 서면으로 명시적으로 언급되지 않는 한 해당 내용을 기반으로 취해진 어떠한 조치에 대해서도 책임을 지지 않습니다.

더 오래된 의견은 없습니다. 소파를 가장 먼저 잡으십시오.