


- AUD/USD recedes from 0.6900 to print two-day losing streak.
- MACD flirts with the bears, signals 100-bar SMA retest before highlight the key Fibonacci retracements.
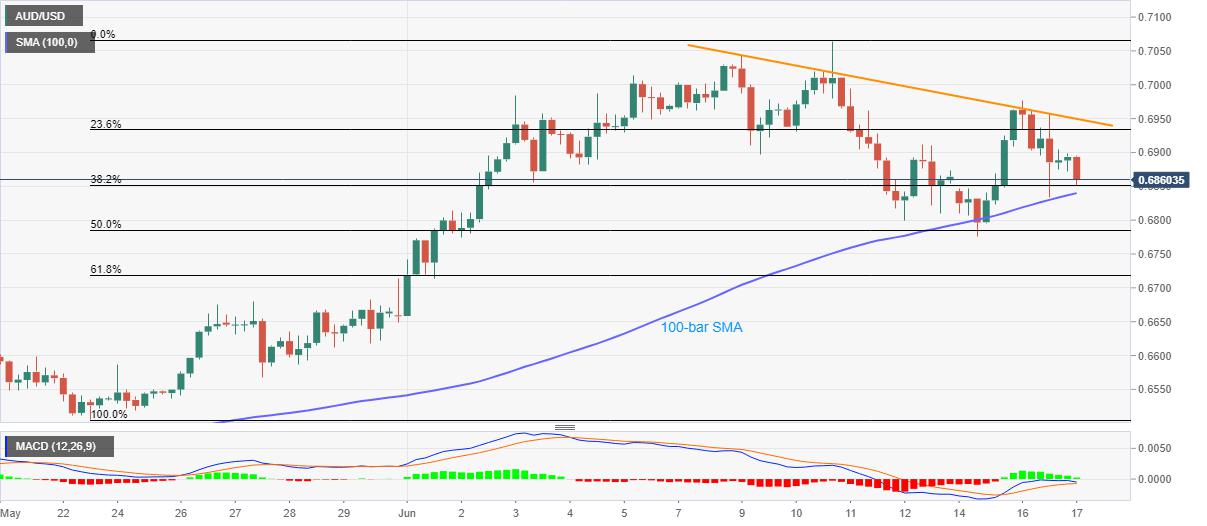
- A falling trend line from June 09 holds the door for the fresh run-up to challenge the monthly top.
AUD/USD bounces off intraday low of 0.6852 to 0.6863 during the early Wednesday’s trading session. Even so, the pair drops 0.36% on a day while printing a two-day losing streak by the press time.
The Aussie pair has recently been compressed by the weekly resistance line, which in turn tracks the MACD histogram that signals the receding strength of the buyers.
As a result, the quote could revisit a 100-bar SMA level of 0.6840 whereas the further declines depend upon how well it breaks 50% Fibonacci retracement level of its May 22-June 07 upside, also comprising the weekly low near 0.6775.
Should the AUD/USD prices remain weak past-0.6775, 61.8% Fibonacci retracement level near 0.6720 will be the key as a break of which could aim for May 27 high of 0.6680.
Meanwhile, the pair’s upside clearance of the said resistance line, at 0.6950 now, enables it to challenge the 0.7000 threshold. Additionally, a sustained rise beyond 0.7000 could easily refresh the monthly top surrounding 0.7065.
AUD/USD four-hour chart
Trend: Further downside expected
원저자가 모두 저작권을 보유한 FXStreet에서 재 인쇄 함.
면책 조항: 본 게시글에 표현된 견해는 전적으로 작성자의 견해이며 Followme의 공식 입장을 대변하지 않습니다. Followme는 제공된 정보의 정확성, 완전성 또는 신뢰성에 대해 책임을 지지 않으며, 서면으로 명시적으로 언급되지 않는 한 해당 내용을 기반으로 취해진 어떠한 조치에 대해서도 책임을 지지 않습니다.

