


Analysts remain cautious on QS because the company is still pre‑revenue and continues to burn cash. Even so, they highlight recent manufacturing progress and note that partnerships like Honda and Volkswagen keep long‑term potential alive. We see this mixed sentiment creating wide price targets and uneven expectations for the next quarters.
At the same time, analysts warn that commercialization delays remain the biggest risk. However, they also point to strong liquidity and improving pilot‑line performance as positive signs. We expect these themes to dominate analyst commentary over the next three months as QS works to prove it can scale its solid‑state technology.
Elliott Wave Outlook: QuantumScape (QS) Weekly Chart May 2026
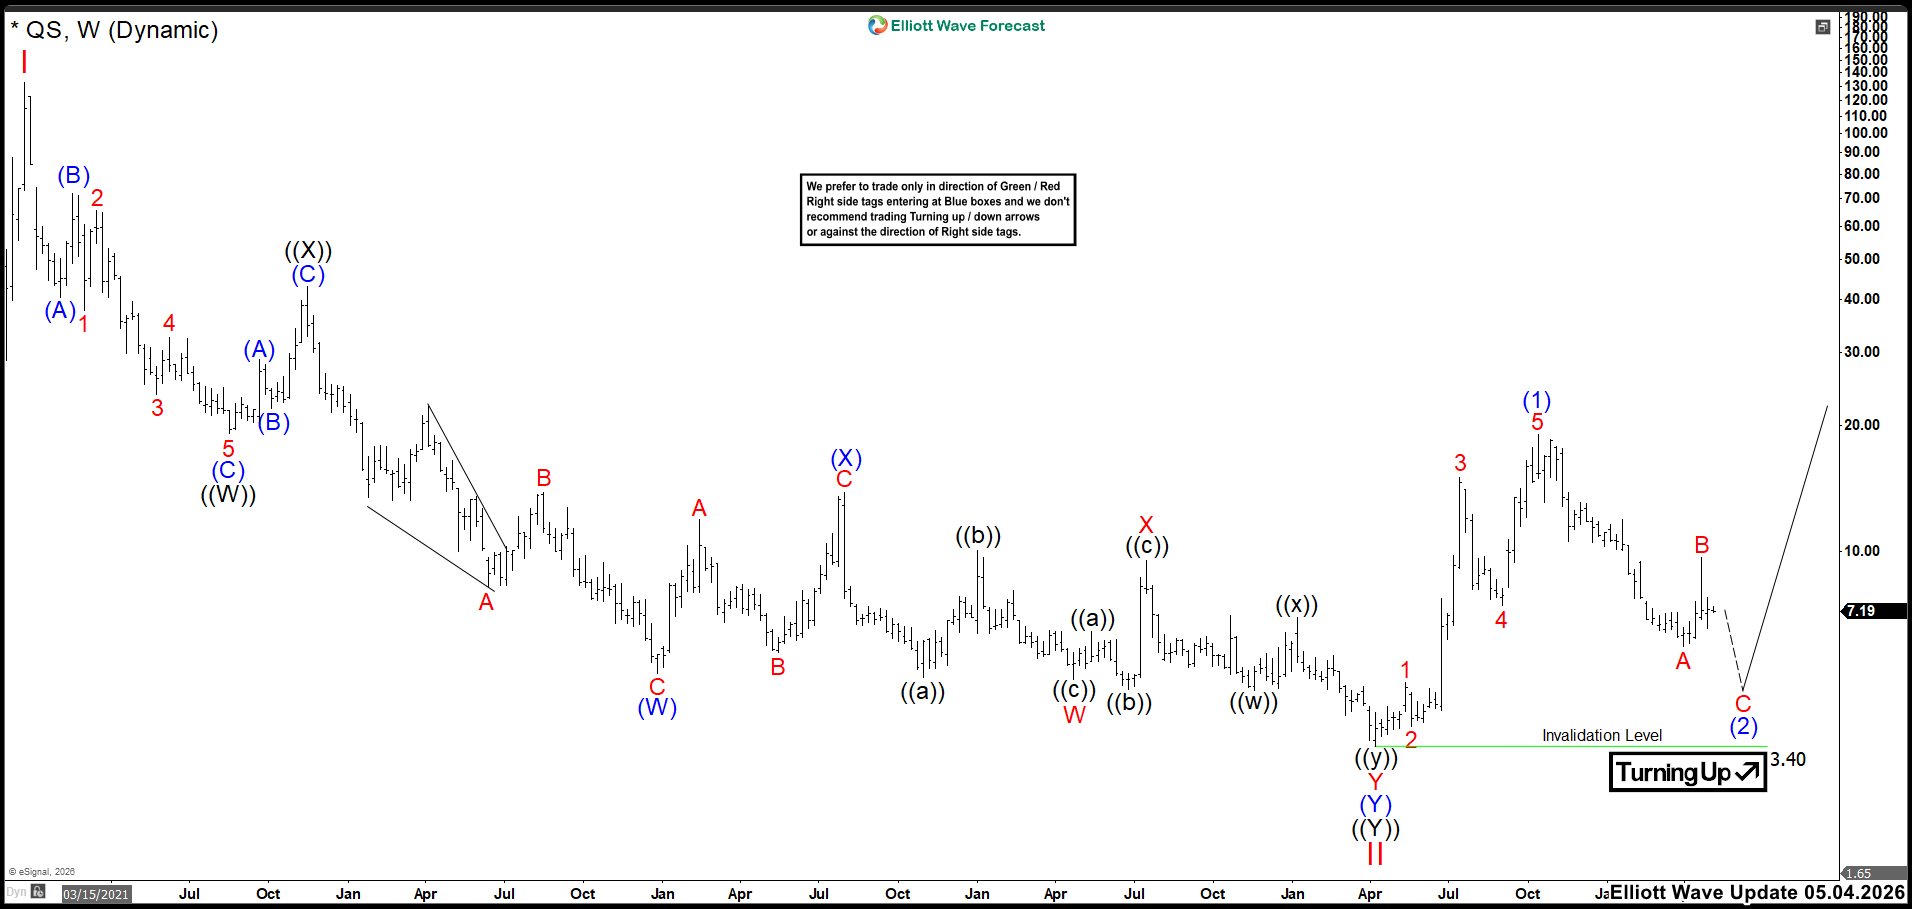
Back in May, wave A fell harder than we expected and hit the 6‑dollar zone. We saw QS bounce to 9.66 and complete Wave B. After that bounce, we still expected more downside to finish three waves and complete the Wave (2) correction. Only then were we ready to look for buying setups to trade Wave (3) of the impulse.
We viewed the ideal area to finish the correction between 5.03 and 3.60. In that region, the market had to show a strong bullish reaction to confirm the pullback had ended and the next upward cycle could continue.
(If you want to learn more about Elliott Wave Principle, please follow these links: Elliott Wave Education and Elliott Wave Theory.)
Elliott Wave Principle Behind the Market Structure
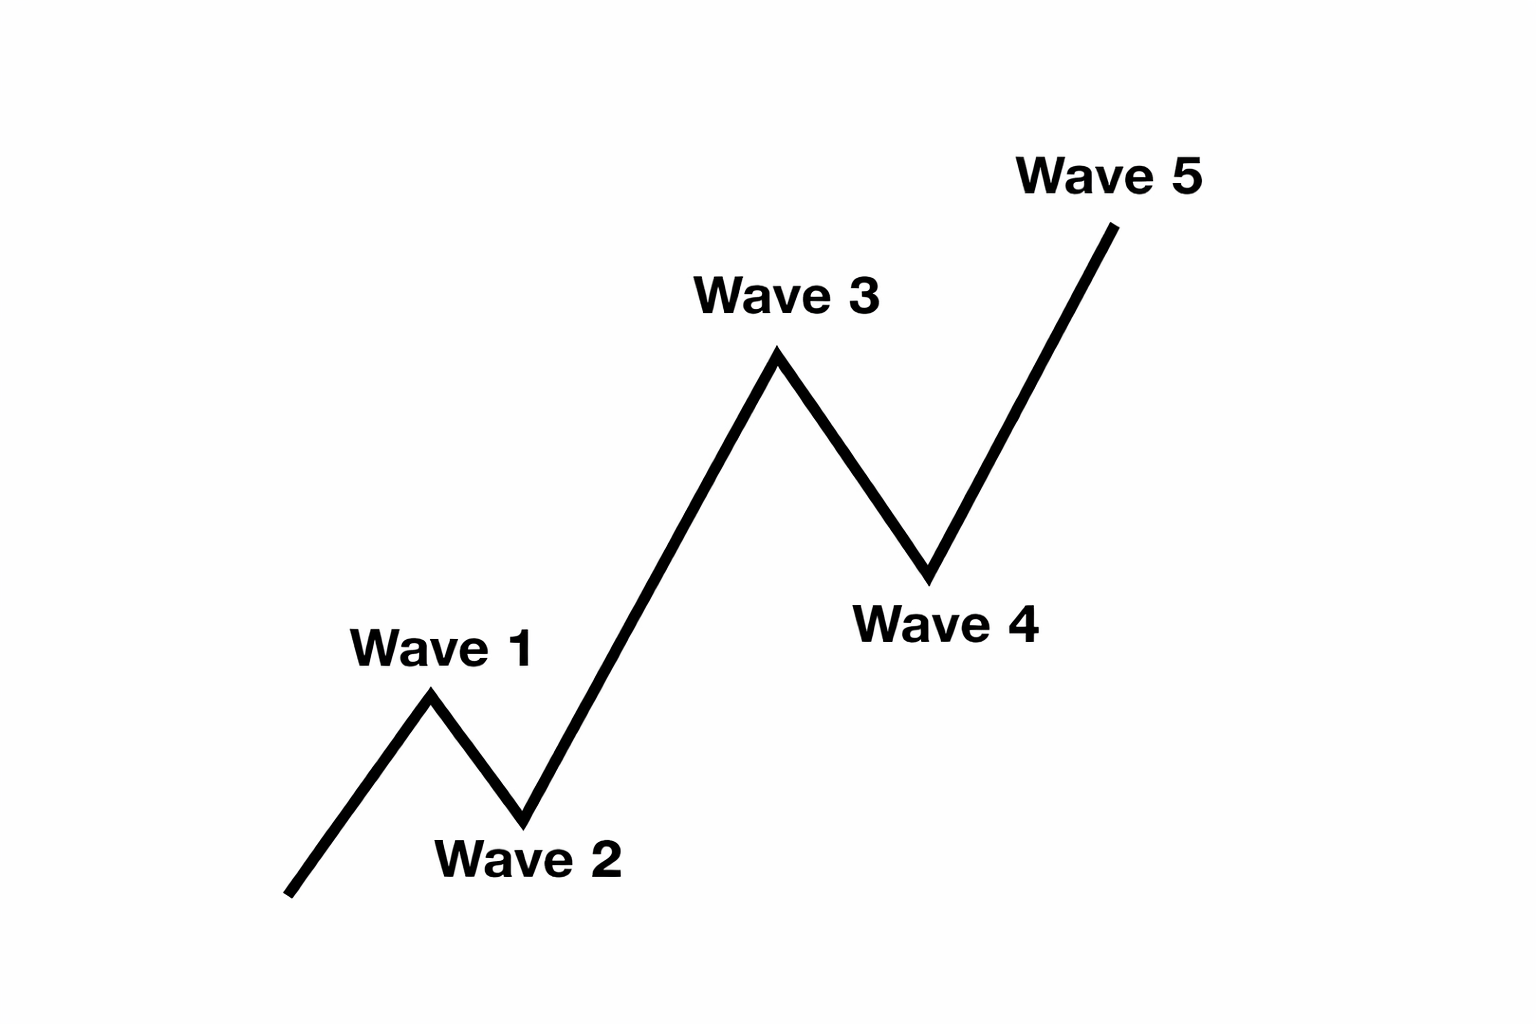
Impulse
An impulse is a clean 5‑wave pattern that drives the trend forward.
- Waves 1‑3‑5 are strong and directional.
- No overlap between waves 1 and 4.
- Wave 3 is usually the strongest.
- Structure is clear, with increasing momentum.
Elliott Wave Outlook: QuantumScape (QS) Weekly Chart August 2026
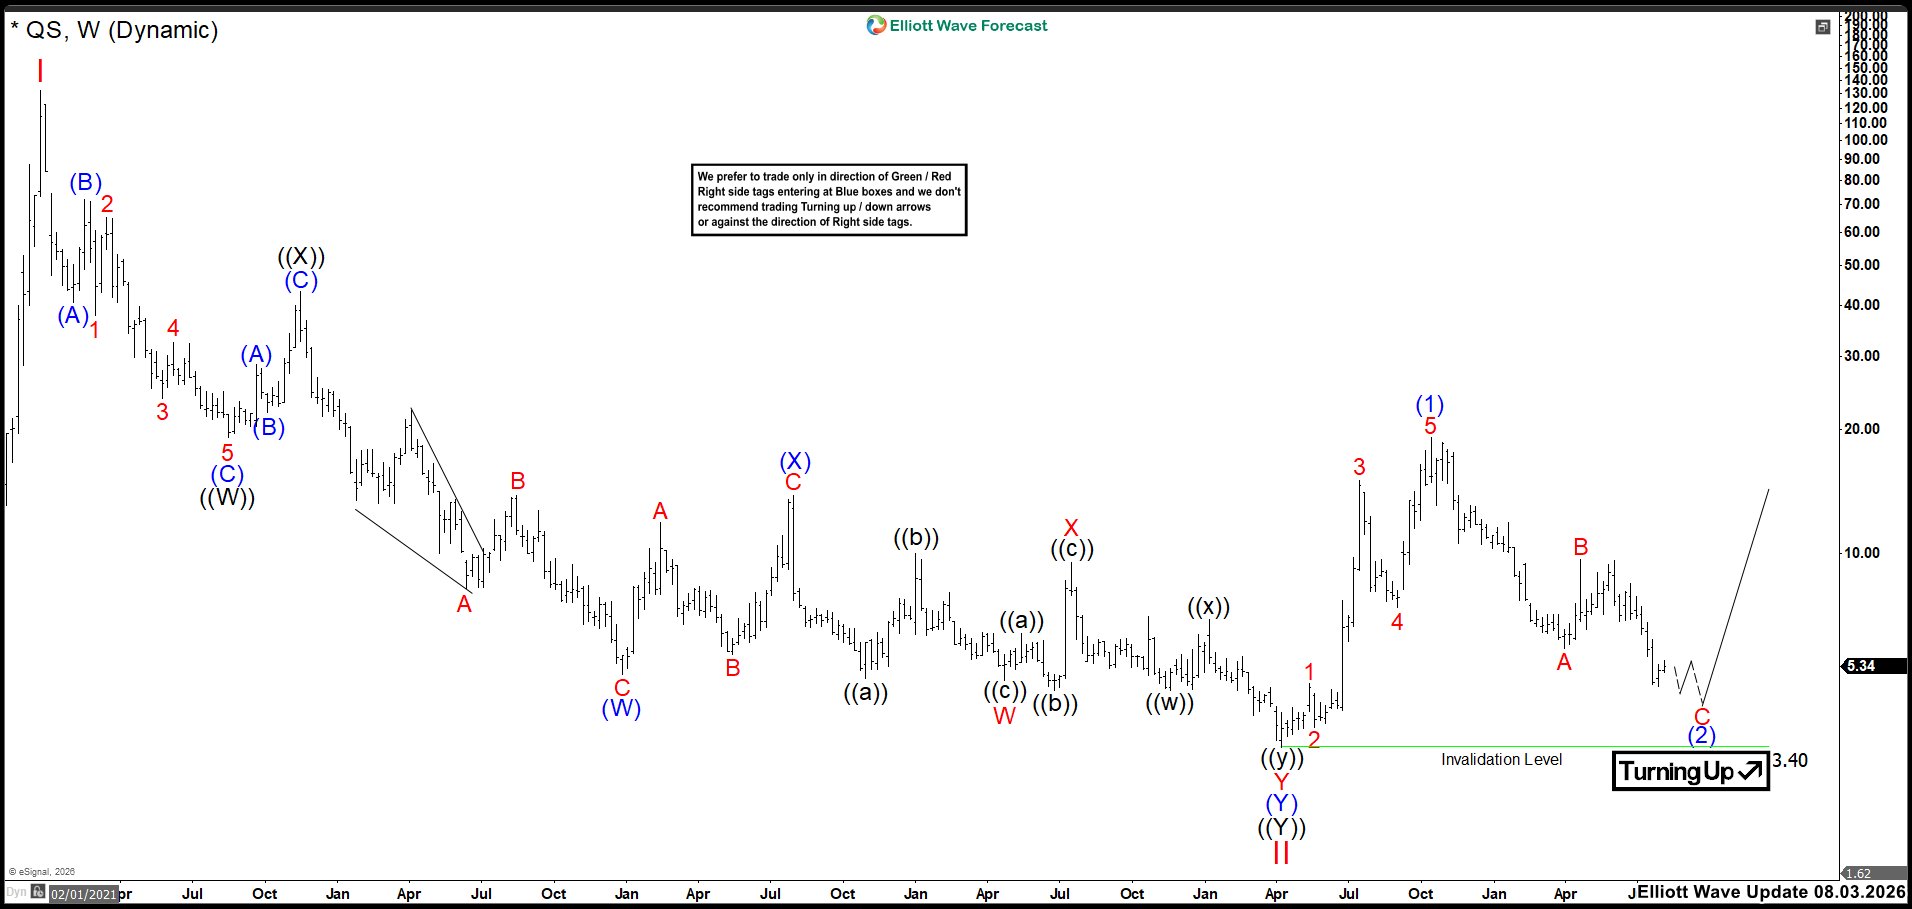
As we see on the chart, Wave B resisted the buyers’ pressure and the market continued lower. Price has already reached the 5.03–3.60 zone, and it could start moving higher from here. Even so, the short‑term bearish structure still looks incomplete, and we expect more downside before the trend can turn.
At this stage, we ideally want to see two additional lows to complete the Wave C impulse and form a clean bottom. In the worst case, the market may produce one final low below 4.77 before confirming a bullish reversal. Once that structure finishes, we will look for signs that the next upward cycle is ready to begin.
면책 조항: 본 게시글에 표현된 견해는 전적으로 작성자의 견해이며 Followme의 공식 입장을 대변하지 않습니다. Followme는 제공된 정보의 정확성, 완전성 또는 신뢰성에 대해 책임을 지지 않으며, 서면으로 명시적으로 언급되지 않는 한 해당 내용을 기반으로 취해진 어떠한 조치에 대해서도 책임을 지지 않습니다.

