


In this Elliott Wave update, we examine the long-term structure in the SPDR S&P Oil & Gas Exploration & Production ETF ($XOP). The ETF continues to show a bullish double-nest structure from the 2020 low, which supports additional upside over the longer term. However, $XOP currently trades at an important inflection point. The correction against the April 2025 low may have already ended, or the ETF may need a deeper 7-swing pullback before the larger bullish trend resumes.
5 Wave Impulse + ABC correction + WXY correction
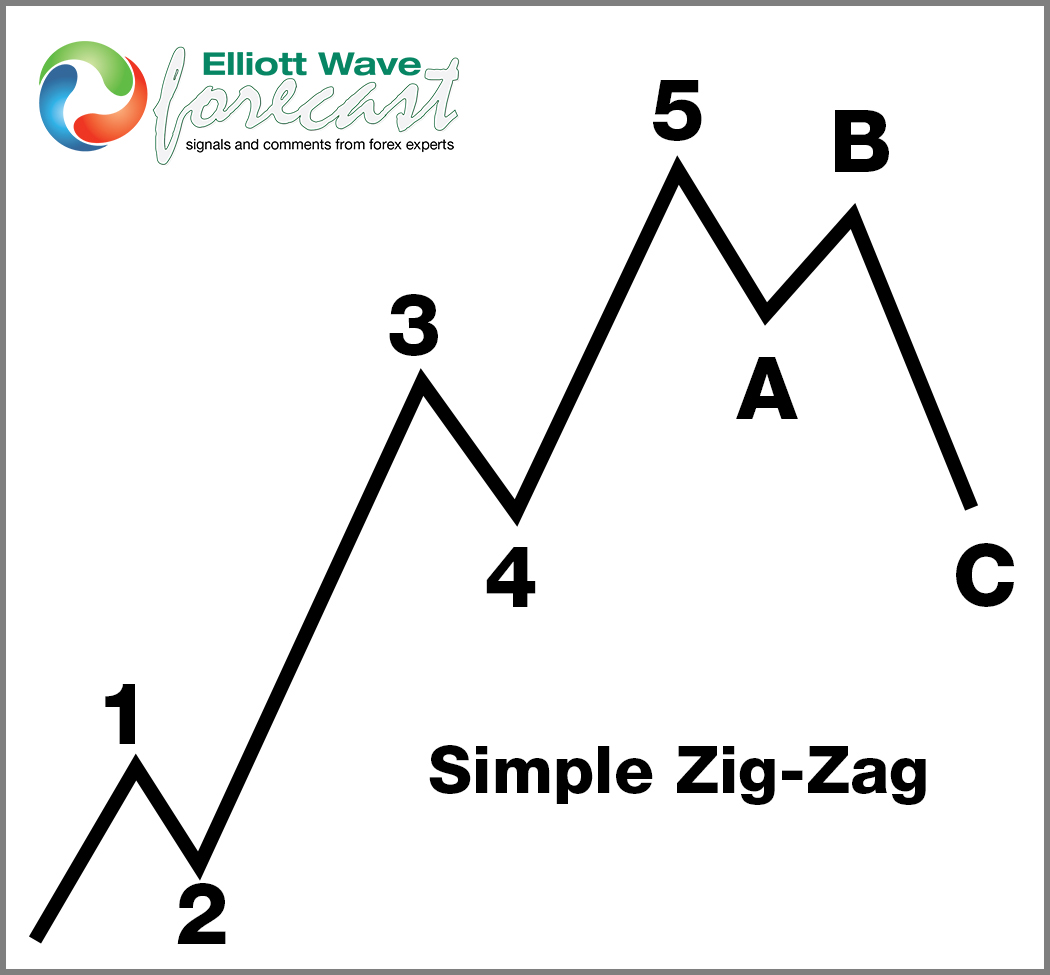
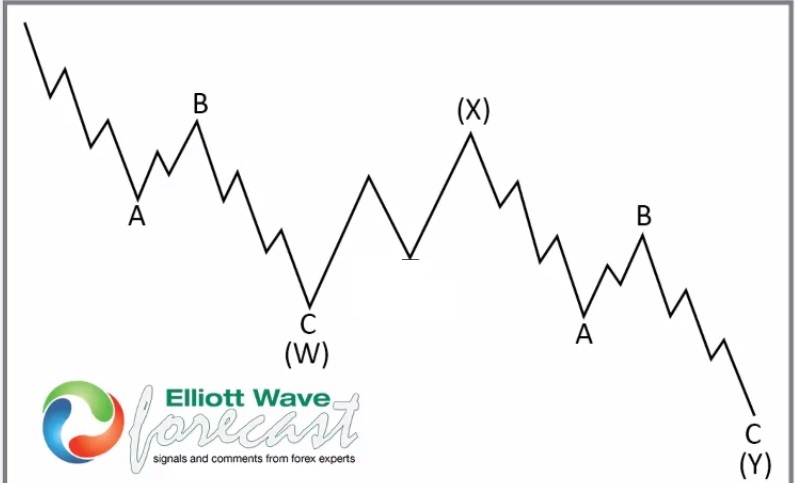
$XOP Shows a Double Nest From the 2020 Low
Looking at the weekly chart, XOP established an important low in 2020 and then advanced in five waves to complete wave ((1)). Afterward, the ETF corrected that rally in a 7 swing (WXY) structure and formed wave ((2)) at the April 2025 low.
The strong rally from that low appears to have completed another five-wave advance in wave (1). Consequently, the larger structure now displays a bullish double nest. This pattern often occurs before a powerful third-wave acceleration, which keeps the long-term outlook constructive.
April 2025 Low Started a New Bullish Cycle
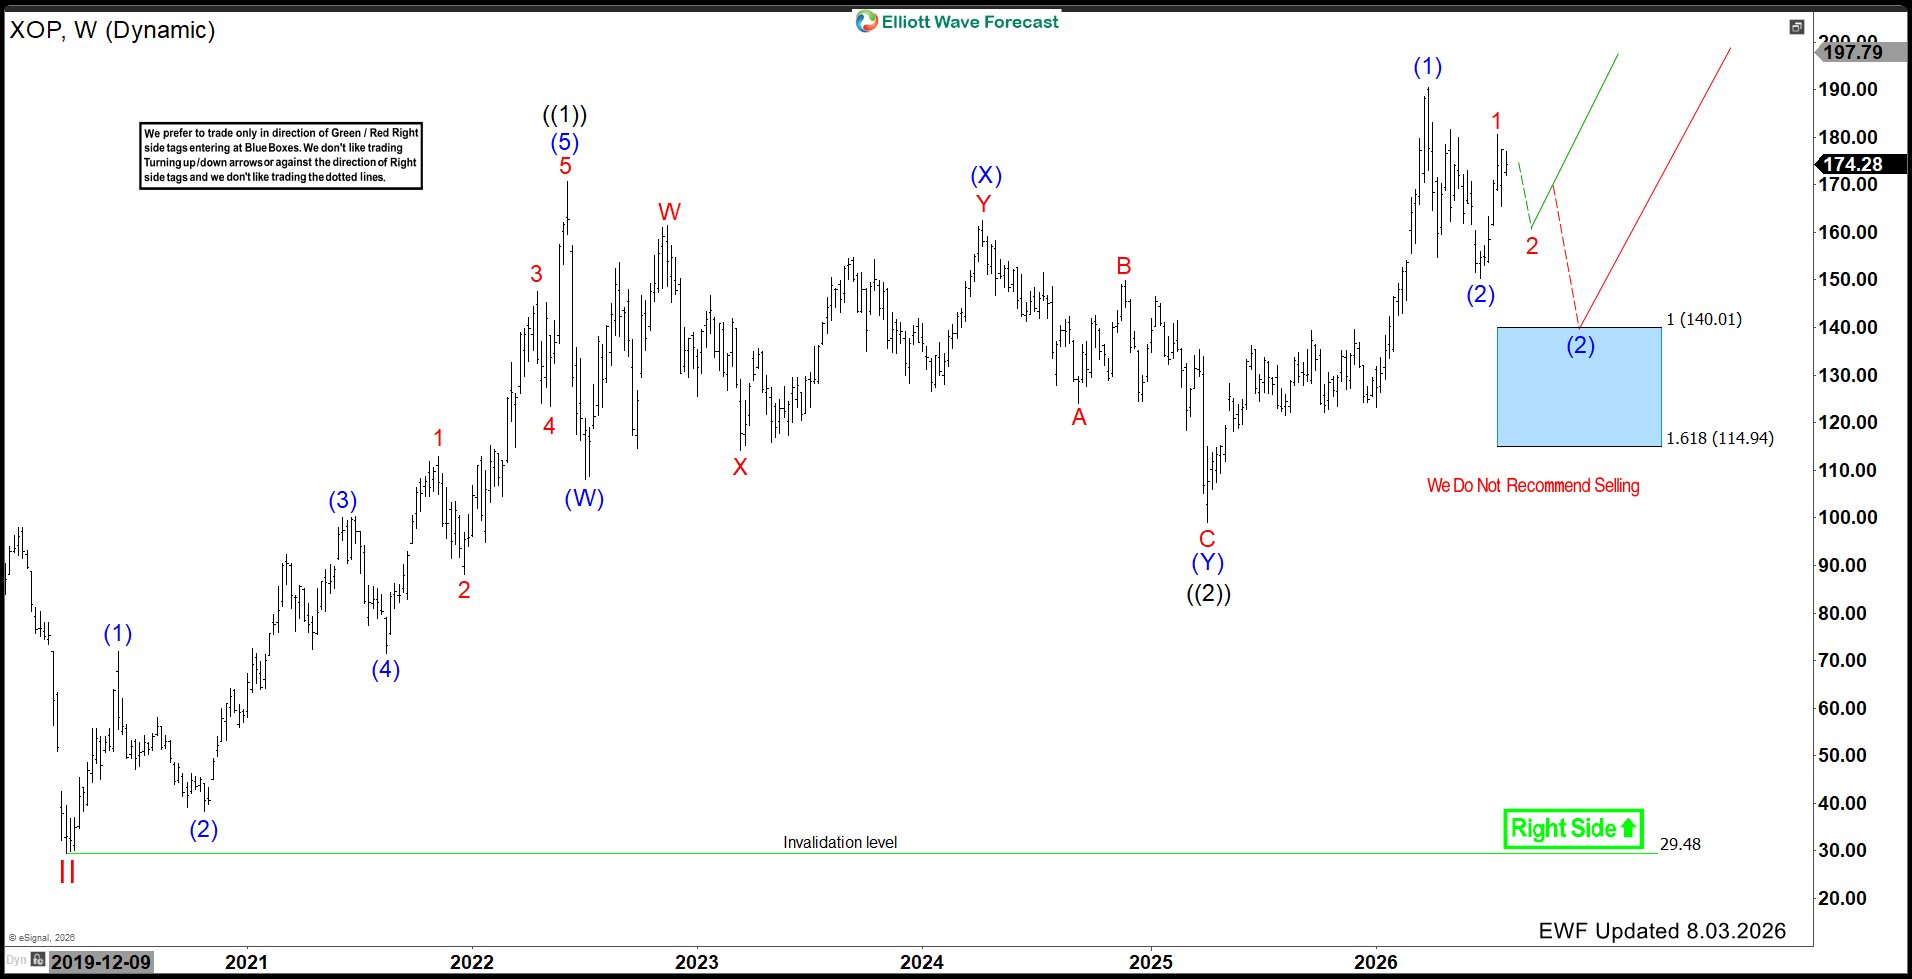
From the April 2025 low, $XOP rallied sharply and reached the 2026 peak near the $190 area. That advance can be counted as a completed five-wave impulse in wave (1).
The ETF then pulled back in wave (2) and found support near the $150 area. Since that low, price has started to recover and may already be building the next impulsive sequence. Nevertheless, the current structure has not yet confirmed whether the correction fully ended at that low.
$XOP Is Trading at an Important Inflection Point
At this stage, two possible scenarios remain in play.
In the first scenario, wave (2) already ended near the recent low. Under this view, the current rally represents wave 1 of a new impulsive advance. A short-term pullback in wave 2 should remain supported, followed by another strong move higher.
However, $XOP could still fail to sustain the current recovery. In that case, the correction against the April 2025 low may remain incomplete and develop as a larger 7-swing structure.
Therefore, the next pullback and subsequent price reaction should help clarify which path the ETF will follow.
Blue Box Area Offers the Alternative Buying Opportunity
If $XOP extends the correction in 7 swings, the next major support comes within the Blue Box Area between 140.01 and 114.94. This region represents the 100%–161.8% Fibonacci extension of the corrective sequence.
Typically, buyers are expected to enter within a Blue Box Area and produce at least a three-wave reaction higher. Accordingly, we do not recommend selling into this zone. Instead, the area should provide another buying opportunity in the direction of the larger bullish trend.
A decline into the Blue Box would not necessarily damage the long-term outlook. Rather, it could complete wave (2) at a lower level before the next major advance begins.
What Comes Next for $XOP?
The preferred bullish scenario calls for the recent low to hold. In that case, XOP should complete a short-term pullback and then continue higher toward and eventually above the 2026 peak.
Alternatively, a failure to hold the recent support would open a deeper corrective path toward 140.01–114.94. Buyers would then be expected to enter the Blue Box and support the next bullish cycle.
In both scenarios, the larger direction remains higher. The primary uncertainty concerns whether wave (2) has already ended or requires another 7-swing decline first.
Technical Summary
To summarize, $XOP shows a bullish double nest from the 2020 low, and the April 2025 low appears to have started another long-term advance. The ETF now trades at an important inflection point.
The recent low may have completed wave (2), allowing a new impulsive rally to develop. However, if the recovery fails, $XOP can pull back in 7 swings toward the 140.01–114.94 Blue Box Area, where another buying opportunity should develop.
The broader bullish sequence remains valid above the long-term 29.48 invalidation level. Therefore, whether the next low has already formed or develops inside the Blue Box, the larger outlook continues to favor additional upside.
면책 조항: 본 게시글에 표현된 견해는 전적으로 작성자의 견해이며 Followme의 공식 입장을 대변하지 않습니다. Followme는 제공된 정보의 정확성, 완전성 또는 신뢰성에 대해 책임을 지지 않으며, 서면으로 명시적으로 언급되지 않는 한 해당 내용을 기반으로 취해진 어떠한 조치에 대해서도 책임을 지지 않습니다.

