


Walmart (NYSE: WMT) ended its rally from the April 2025 low triggering a larger degree correction. We mentioned this idea earlier this year in our previous article. Today, we explain the Elliott Wave structure unfolding now. Our analysis leads to the next potential investment opportunity.
Elliott Wave Analysis
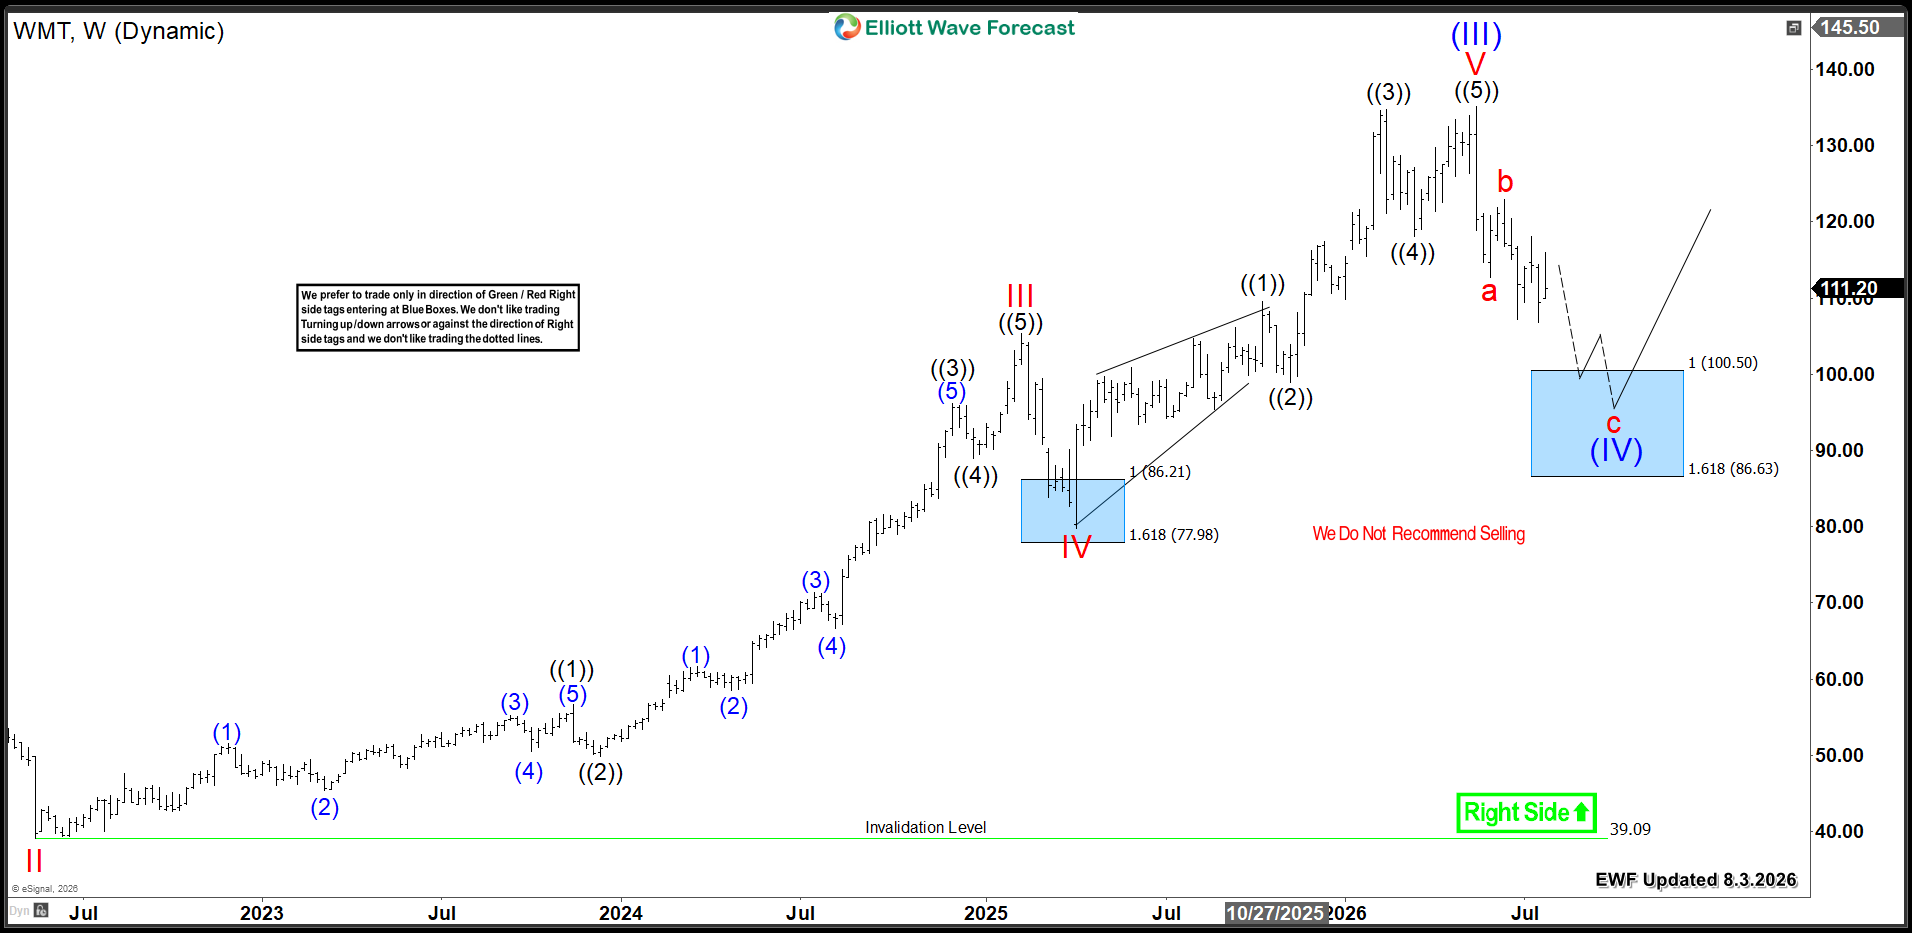
WMT's last rally from the April 2025 Blue Box unfolded as a five-wave advance. This move ended at $135, marking wave (III). From that peak, the stock began a three-wave zigzag correction within wave (IV). Price already established the first two legs, "a" and "b". Consequently, as long as WMT stays below the recent June peak of $116.80, further downside continuation should occur within wave C.
Based on the a-b connector, WMT should reach the $100.50 - $86.63 Blue Box equal legs area. Therefore, buyers and investors should wait for this extreme zone. They will enter the market there and look for the stock to turn higher. It will either resume the rally in wave (V) toward new highs or bounce in three waves at minimum.
Walmart WMT Weekly Chart 08.03.2026
Conclusion
Walmart (WMT) weekly bullish cycle remains firmly intact. Therefore, this correction will create the next strategic buying opportunity before the uptrend resumes.
면책 조항: 본 게시글에 표현된 견해는 전적으로 작성자의 견해이며 Followme의 공식 입장을 대변하지 않습니다. Followme는 제공된 정보의 정확성, 완전성 또는 신뢰성에 대해 책임을 지지 않으며, 서면으로 명시적으로 언급되지 않는 한 해당 내용을 기반으로 취해진 어떠한 조치에 대해서도 책임을 지지 않습니다.

