


Hello traders. In this technical article we’re going to take a quick look at the Elliott Wave charts of Google Stock (GOOGL ) published in members area of the website.
As our members know, Googl stock is forming a corrective pattern against the 379.47 peak. In the following analysis, we explain the Elliott Wave pattern and the market outlook.
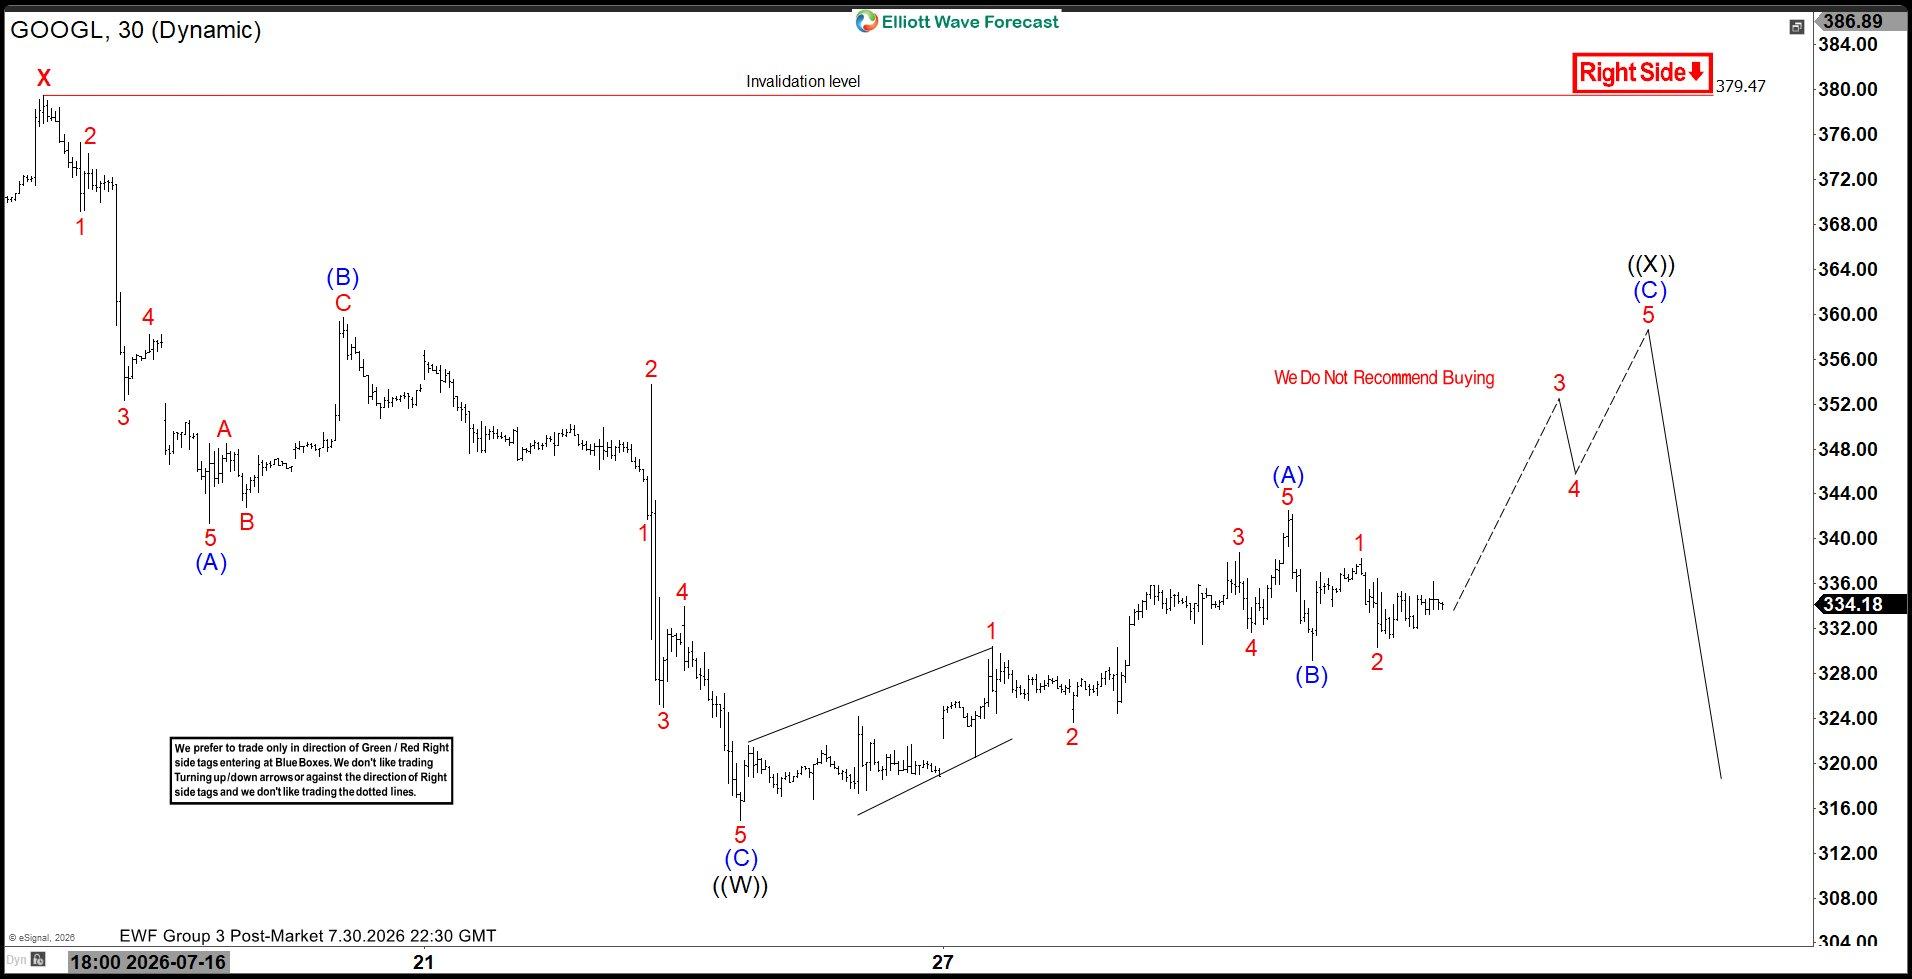
GOOGL Elliott Wave 1 Hour Chart 07.30.2026
Google (GOOGL) is correcting the cycle from the 379.47 peak. So far, we can count a 5-wave structure from the low, suggesting that the first leg higher is complete. At the moment, the pullback structure still appears incomplete. The 5-wave move indicates that the correction is likely forming a Zig Zag pattern (5-3-5). Therefore, we expect another leg higher (C), which should also unfold as a 5-wave structure. Current analysis suggests that wave (B) pullback ended at the 329.42 low. While above this low, wave (C) can be in progress, targeting the 356.86+ zone.
90% of traders fail because they don’t understand market patterns. Are you in the top 10%? Put your skills to the test with this advanced Elliott Wave challenge.
Reminder : Our member chat rooms are open 24/7 and provide ongoing expert guidance on market trends and Elliott Wave analysis. Members are encouraged to ask questions about market structure and technical setups at any time. You can learn more about Elliott Wave Patterns at our Free Elliott Wave Educational Web Page
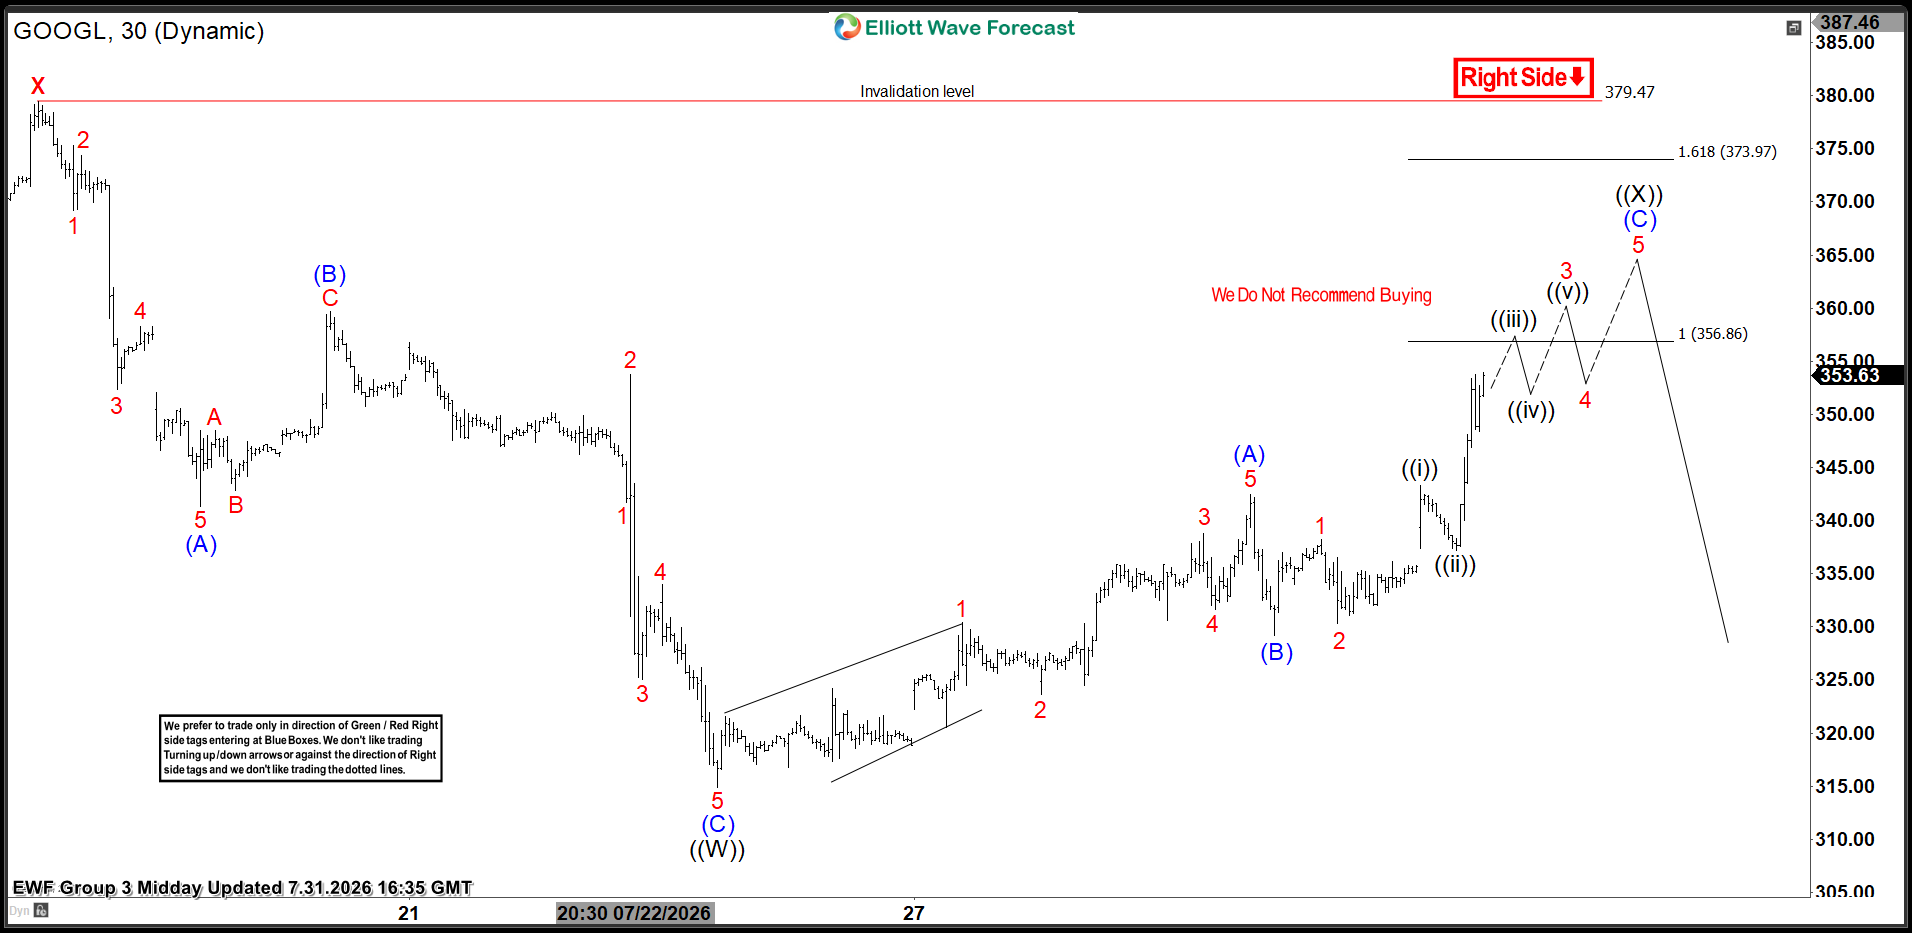
GOOGL Elliott Wave 1 Hour Chart 07.31.2026
The price held above the 329.42 low as expected, and buyers were strong enough to push the price higher. The stock is now approaching our target zone at 356.86–373.97, where we expect sellers to appear again. The key level to watch is 379.47. As long as the pivot at the 379.47 high holds, the preferred view remains intact, and we can see another leg lower once the ((X)) recovery completes.
Keep in mind market is dynamic and presented view could have changed in the mean time. You can check most recent charts in the membership area of the site. Please keep in mind that now every chart is trading recommendation. Best instruments to trade are those having incomplete bullish or bearish swings sequences.We put them in Sequence Report and best among them are shown in the Live Trading Room.
면책 조항: 본 게시글에 표현된 견해는 전적으로 작성자의 견해이며 Followme의 공식 입장을 대변하지 않습니다. Followme는 제공된 정보의 정확성, 완전성 또는 신뢰성에 대해 책임을 지지 않으며, 서면으로 명시적으로 언급되지 않는 한 해당 내용을 기반으로 취해진 어떠한 조치에 대해서도 책임을 지지 않습니다.

