


MCD looks set to correct the full advance that began in 2020. Moreover, price action already signals a developing Wave (II) retracement. The structure shows a clear break in momentum, confirming pressure on the larger cycle. Technically, MCD holds initial support near $245, while it stays below the 50‑day average.
Looking ahead, Wave (II) should target the key Fibonacci retracement zones of the 2020 cycle. Still, the bullish trend remains valid while the 2020 origin stays intact. As a result, traders expect a multi‑month pullback before Wave (III) resumes. A sustained drop under $245 would strengthen the Wave (II) outlook.
Elliott Wave Outlook: McDonald's MCD Weekly Chart April 2026
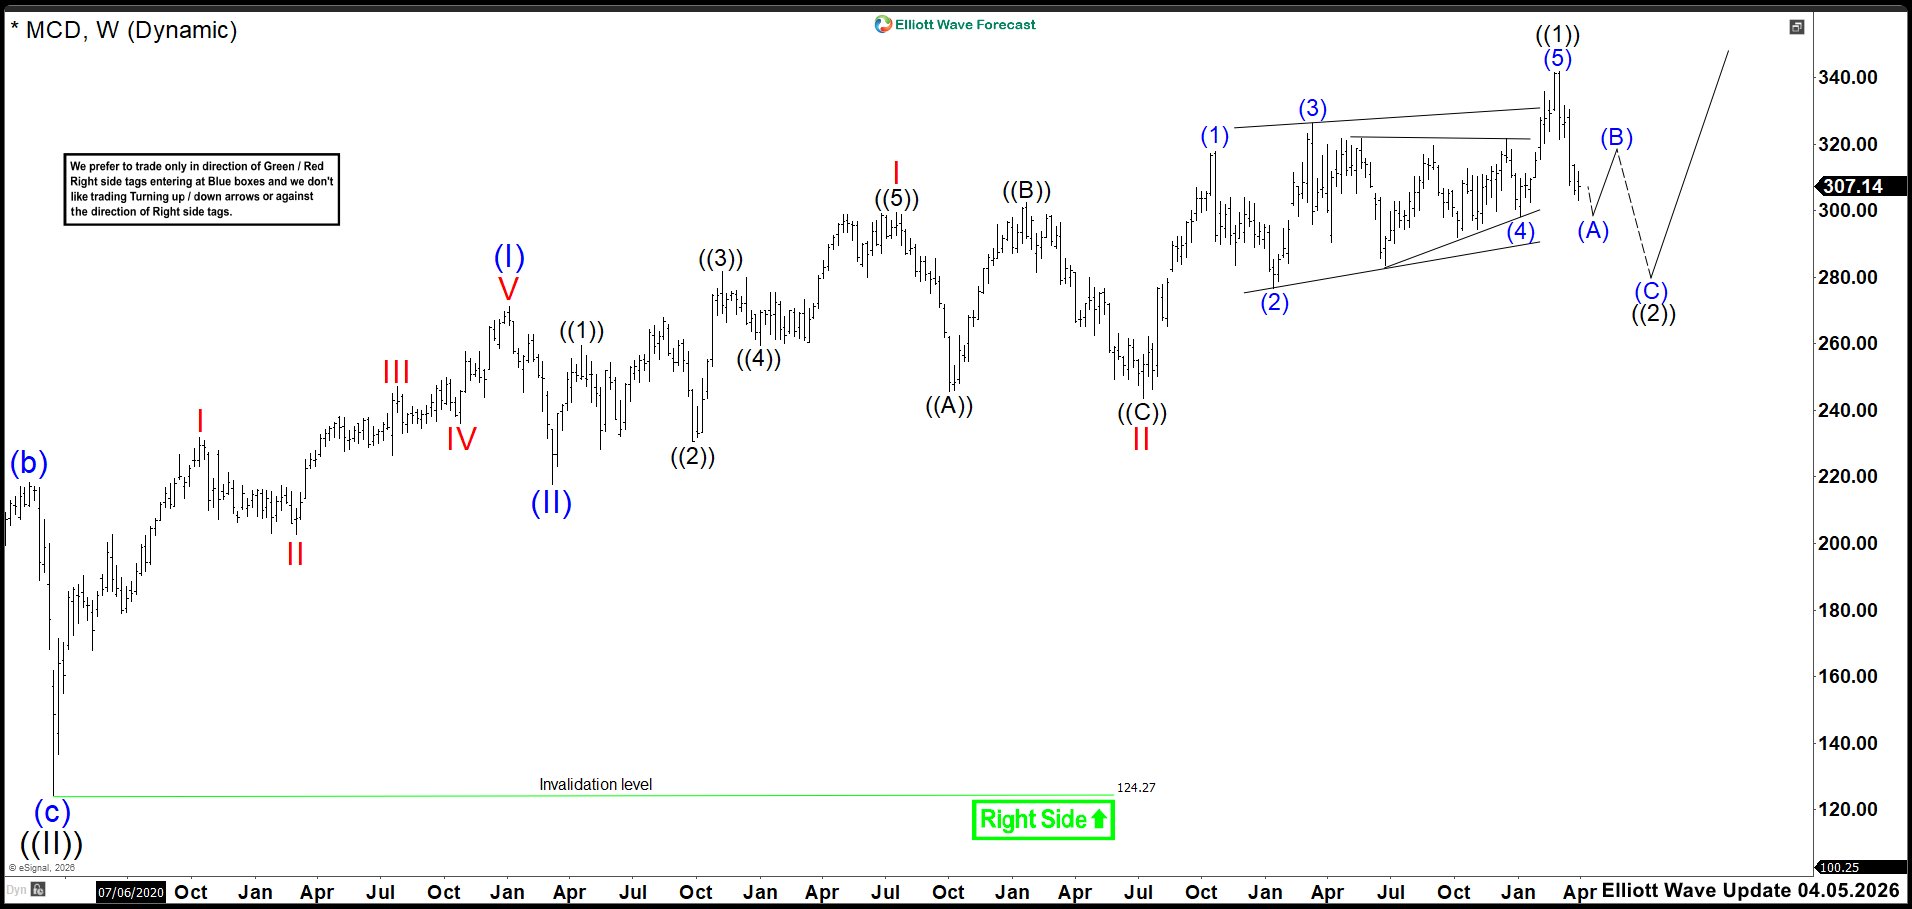
Back in April, we expected MCD to finish its higher high and complete the leading diagonal. Moreover, we anticipated a pullback that would confirm the start of wave ((2)). Price delivered that reaction, yet the corrective structure still looks incomplete. Therefore, we expect continued downside before wave ((2)) fully resolves. The decline could extend into the 292.59–280.99 zone, where wave ((2)) should finish.
After that, the broader bullish cycle should resume, but the process may take months. Consequently, we must stay patient and wait for price to reach the projected support zone. We avoid forcing trades and let the market define the next opportunity.
(If you want to learn more about Elliott Wave Principle, please follow these links: Elliott Wave Education and Elliott Wave Theory.)
Elliott Wave Principle Behind the Market Structure
Impulse
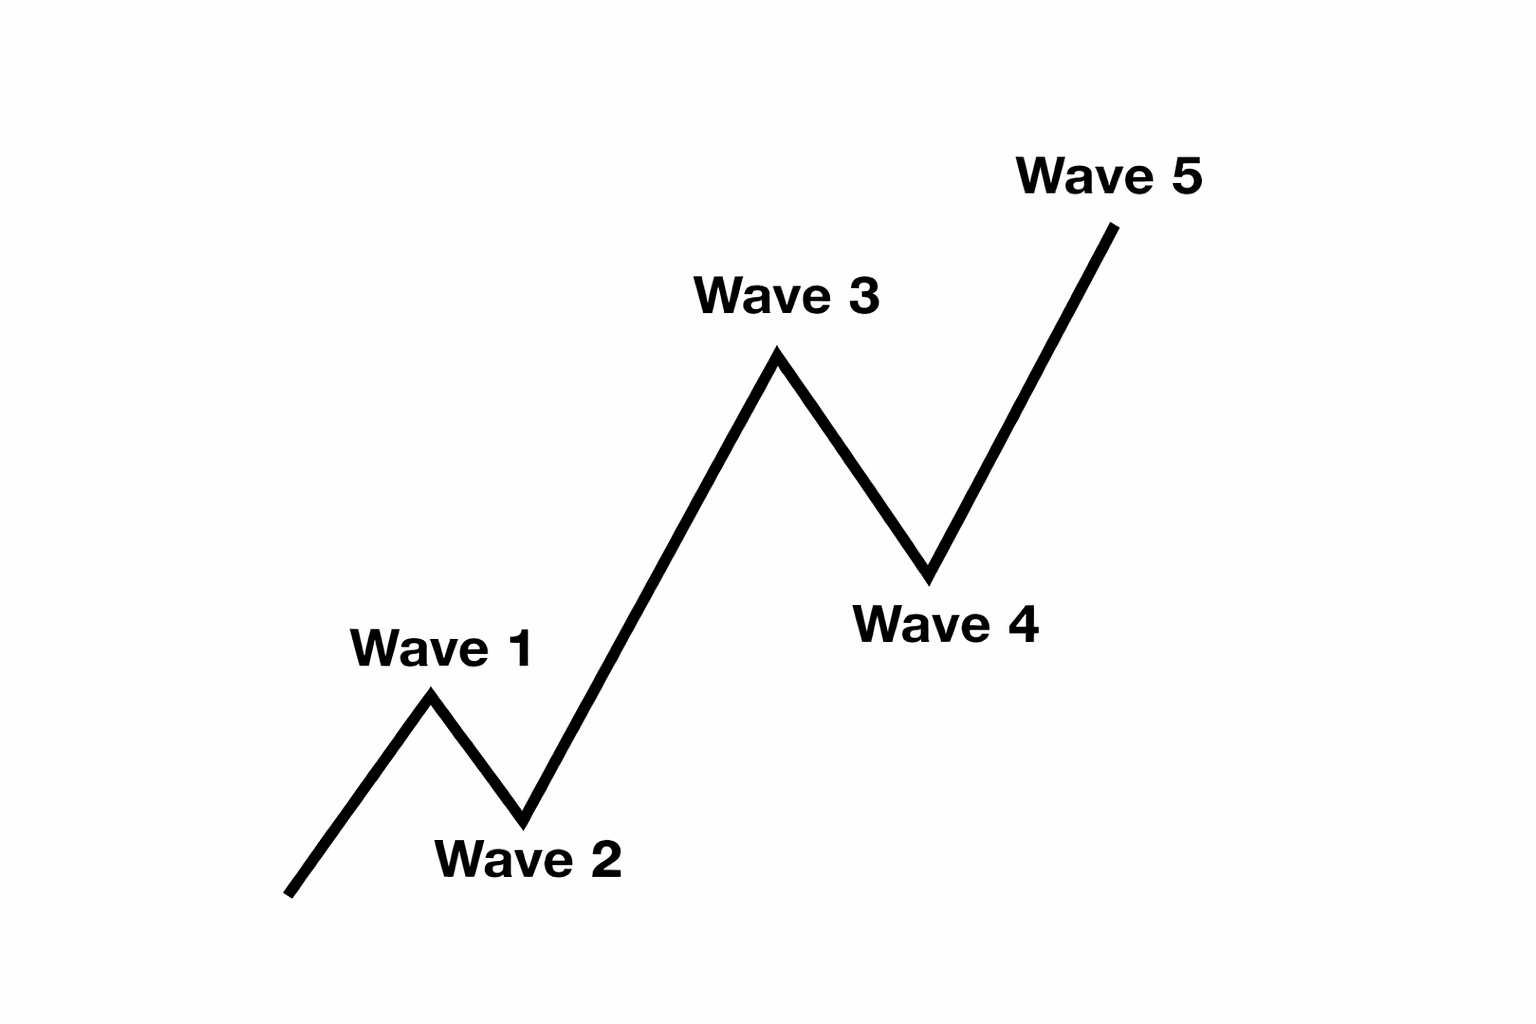
An impulse is a clean 5‑wave pattern that drives the trend forward.
- Waves 1‑3‑5 are strong and directional.
- No overlap between waves 1 and 4.
- Wave 3 is usually the strongest.
- Structure is clear, with increasing momentum.
Elliott Wave Outlook: McDonald's MCD Weekly Chart July 2026
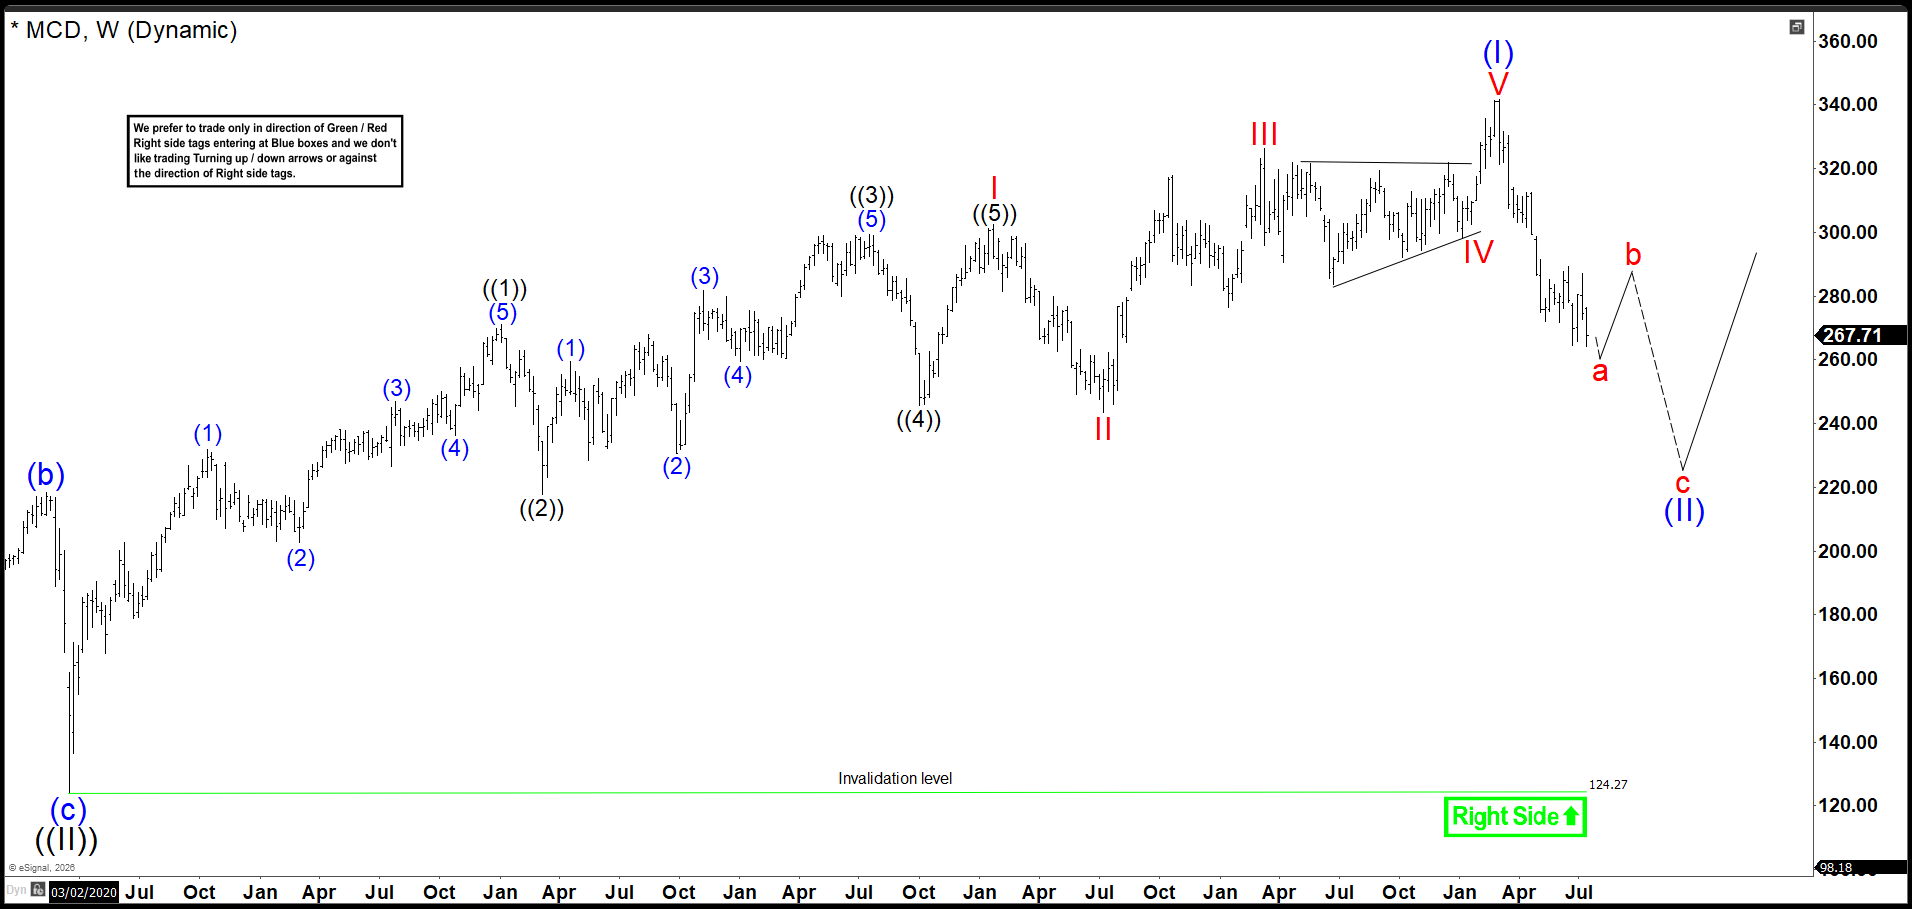
The latest update shows the decline keeps extending, which suggests MCD may be correcting the full cycle from the 2020 low. Therefore, I removed the triple nest and labeled a leading diagonal as wave (I). Now we should expect a rebound soon, which implies the market trades in wave b, which should fail and allow wave c of (II) to continue lower.
This correction could reach the 259.00–207.56 area. If we see a rebound there, the rally may resume and confirm the broader bullish continuation.
면책 조항: 본 게시글에 표현된 견해는 전적으로 작성자의 견해이며 Followme의 공식 입장을 대변하지 않습니다. Followme는 제공된 정보의 정확성, 완전성 또는 신뢰성에 대해 책임을 지지 않으며, 서면으로 명시적으로 언급되지 않는 한 해당 내용을 기반으로 취해진 어떠한 조치에 대해서도 책임을 지지 않습니다.

