


Goldman Sachs (NYSE: GS) extended its rally to new all-time highs. The stock broke above the $1000 milestone as we expected in our previous article. Today, we explore the Elliott Wave pattern dictating the current move. Our analysis explains the potential upside targets ahead.
Elliott Wave Analysis
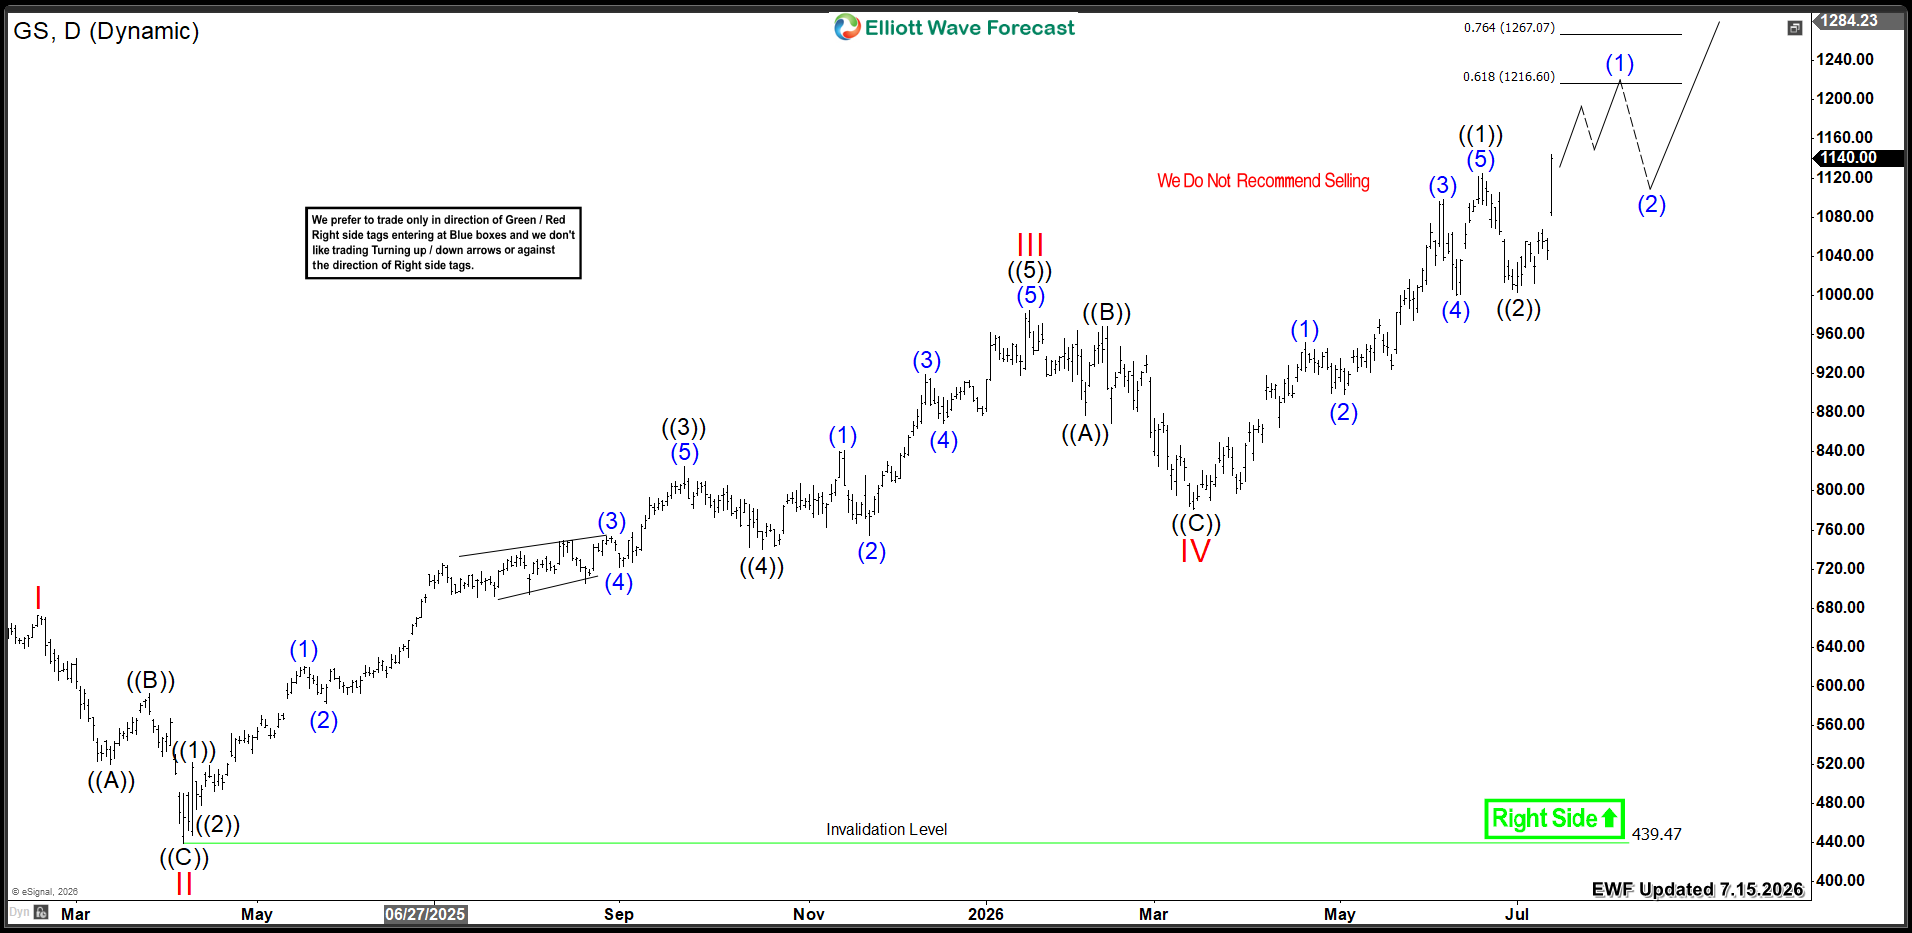
Goldman Sachs extended its rally from the March 2026 low of $780. The stock broke above the wave III peak of $980. Then, it crossed the $1000 milestone, opening the door for further upside. GS established an initial five-wave advance in wave ((1)), ending at $1125. Subsequently, wave ((2)) pulled back to $1003. Then, the stock resumed its rally higher in wave ((3)).
Therefore, GS must hold above the recent July low of wave ((2)). This support will allow the rally to continue. The next upside move should extend the stock toward the $1216 - $1267 target zone. Then, another correction will follow before further continuation.
Ideally, the cycle from the March 2026 low aims for the $1350 - $1560 equal legs area. This would set the stage for a stronger rally by year-end.
GS Daily Chart 7.15.2026
Conclusion
Goldman Sachs’s bullish cycle suggests further continuation beyond $1300 . Consequently, investors should target buying opportunities within daily pullbacks. Utilize our Elliott Wave strategy for precise entry timing.
면책 조항: 본 게시글에 표현된 견해는 전적으로 작성자의 견해이며 Followme의 공식 입장을 대변하지 않습니다. Followme는 제공된 정보의 정확성, 완전성 또는 신뢰성에 대해 책임을 지지 않으며, 서면으로 명시적으로 언급되지 않는 한 해당 내용을 기반으로 취해진 어떠한 조치에 대해서도 책임을 지지 않습니다.

