


Launched in 2010, the Global X Silver Miners ETF (SIL) offers investors diversified access to leading silver mining companies worldwide. By tracking the Solactive Global Silver Miners Total Return Index, it provides a simple, single‑trade entry into the sector. In the following discussion, we present its Elliott Wave technical outlook.
SIL (Silver Miners ETF) Monthly Elliott Wave Chart
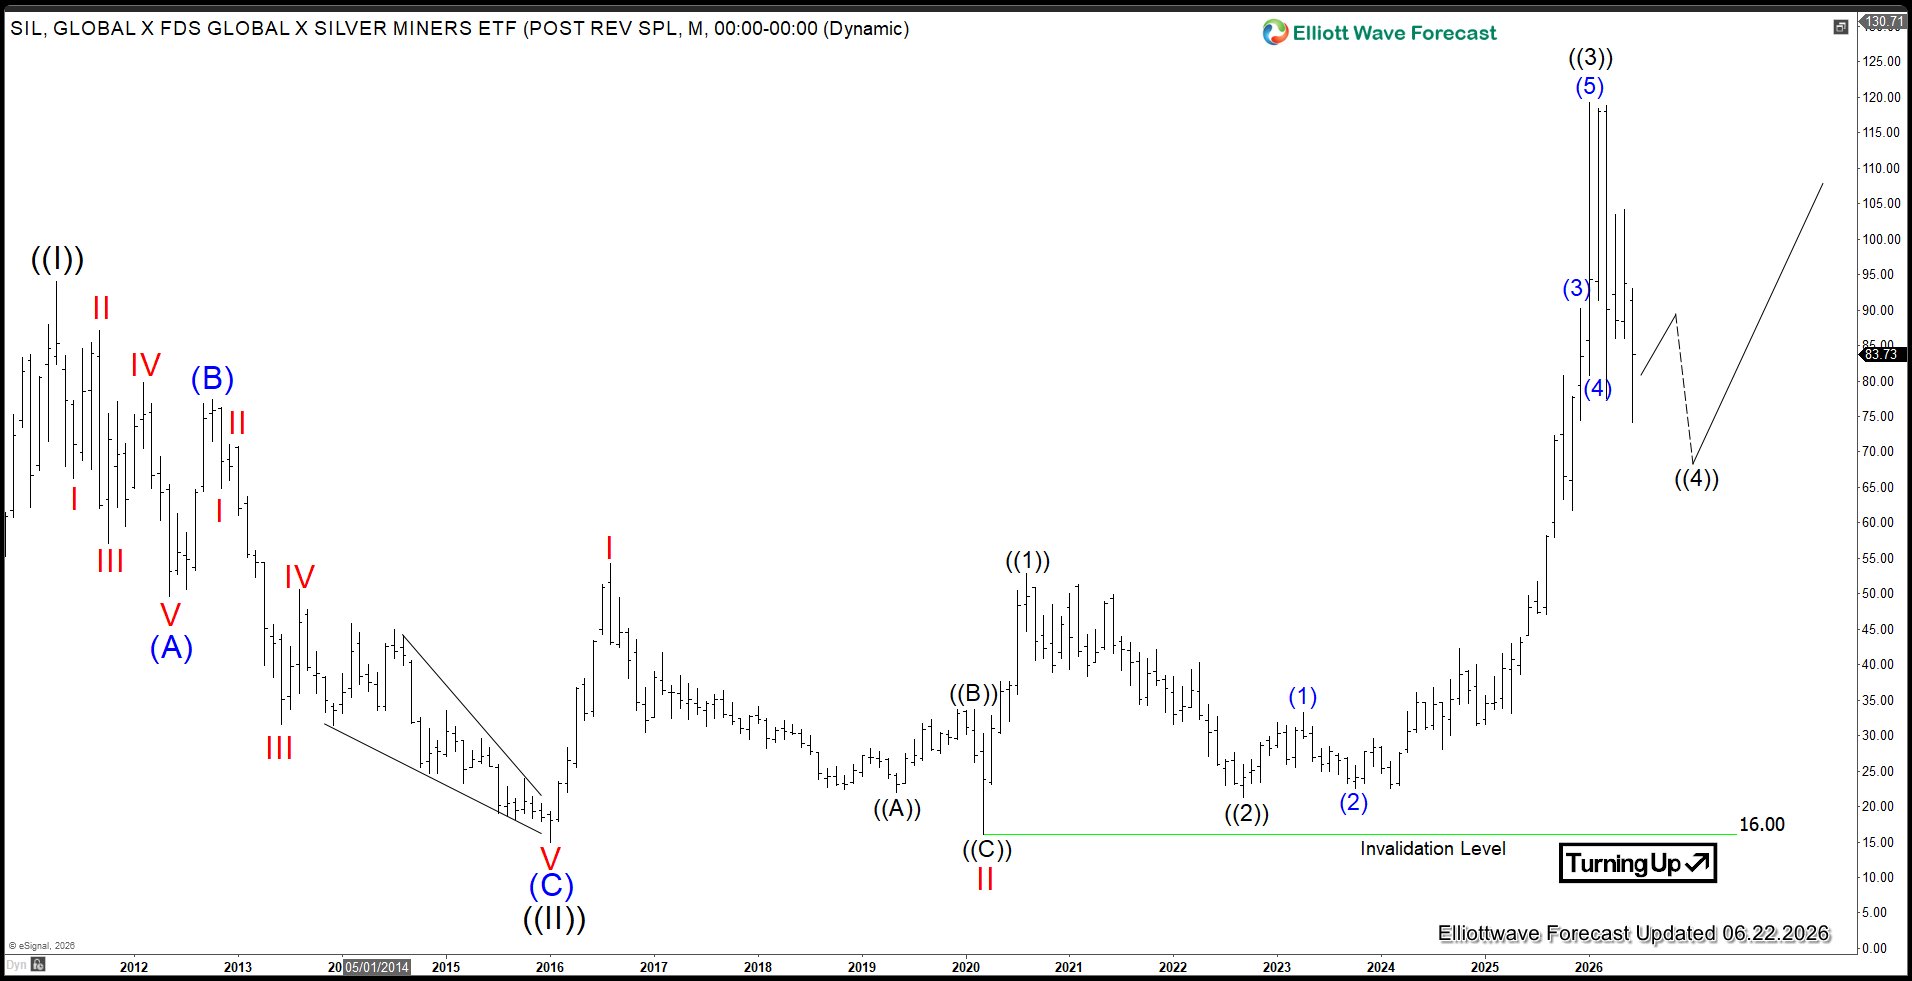
The monthly Elliott Wave chart of the Silver Miners ETF (SIL) indicates that the instrument achieved a fresh all‑time high in January of this year, reinforcing a bullish right‑side outlook. A major low completed in January 2016 at $14.94, which we identify as Grand Super Cycle wave ((II)). From this base, SIL has begun to nest higher within wave ((III)).
Advancing from wave ((II)), wave I concluded at $54.34. A corrective decline followed in wave II that bottomed at $16. The ETF then rallied in wave ((1)) to $52.87, with the subsequent pullback in wave ((2)) ending at $21.26. A powerful advance in wave ((3)) carried prices to $119.24. Currently, the ETF is undergoing a corrective phase in wave ((4)). The pullback subdivides into a seven‑swing structure from the September 2022 low. Once this correction completes, SIL should resume its upward trajectory in alignment with the larger bullish cycle.
Silver Miners ETF Daily Elliott Wave Chart
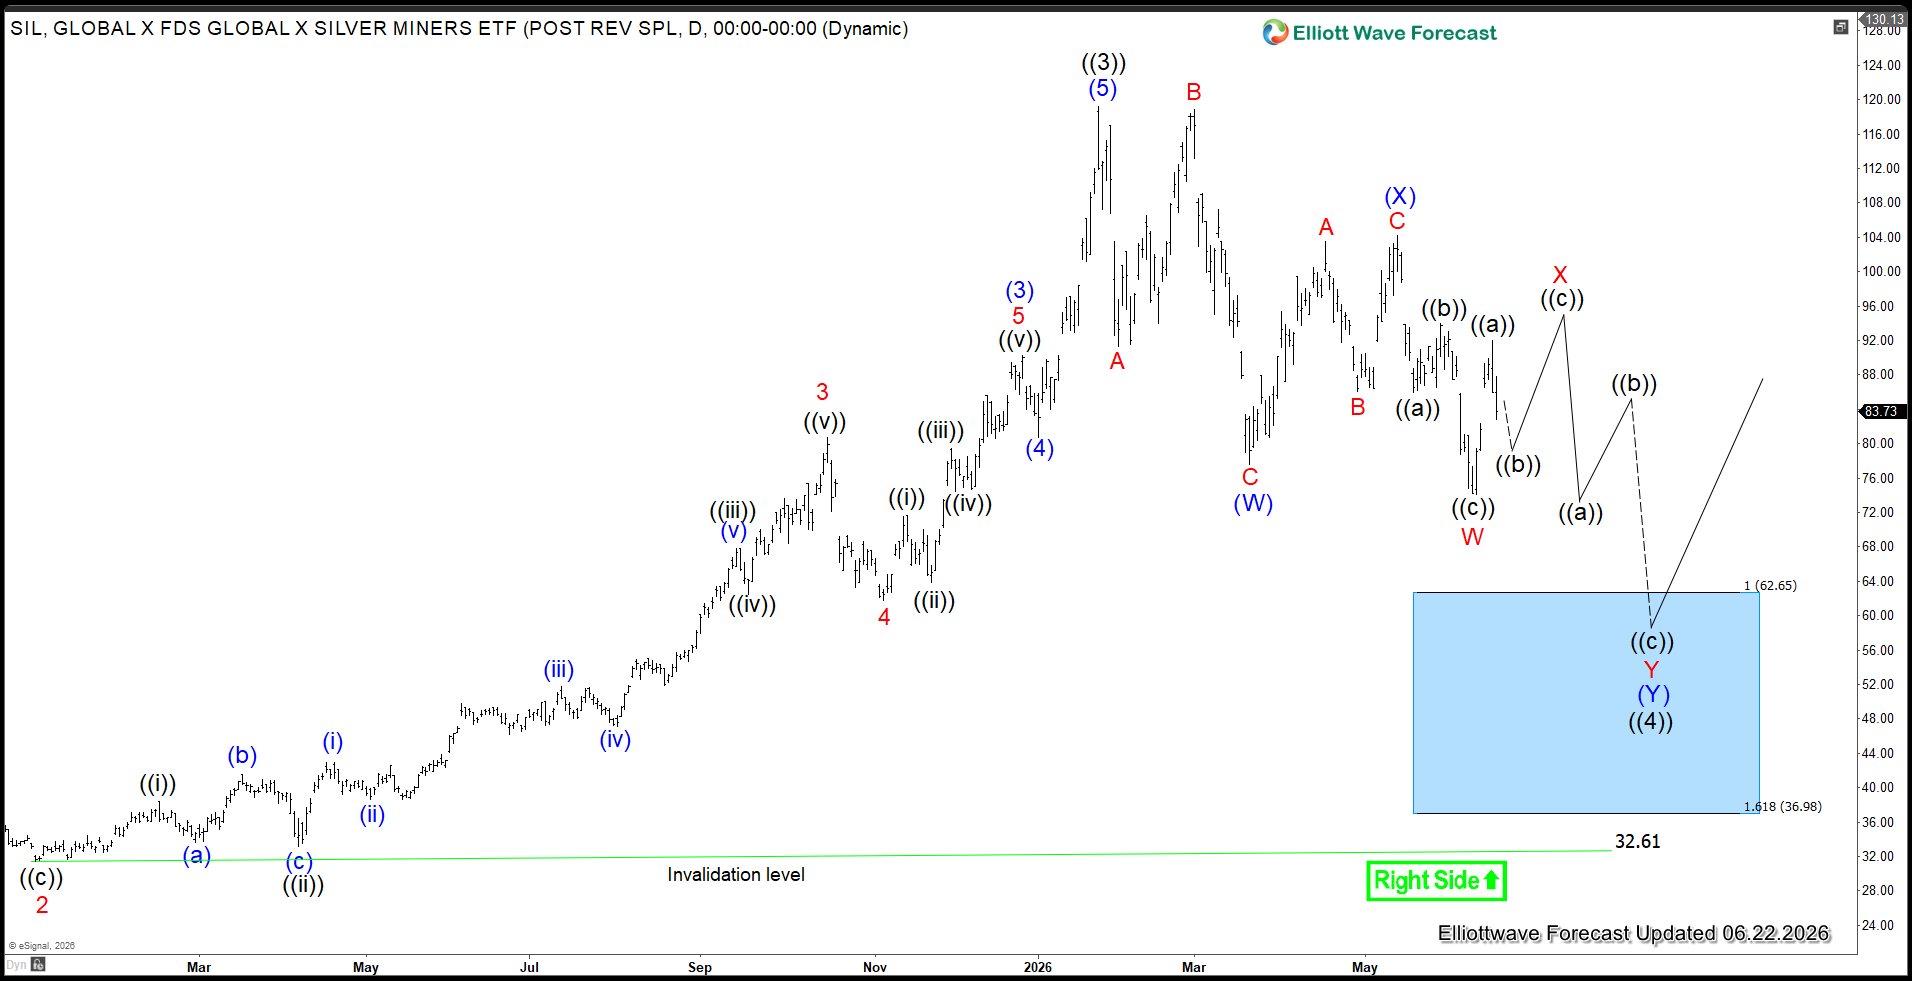
The daily Elliott Wave chart of the Silver Miners ETF (SIL) indicates that the rally in wave ((3)) has concluded, and a corrective pullback in wave ((4)) is currently unfolding within a seven‑swing double three structure. From the peak of wave ((3)), wave (W) ended at $77.58, followed by a rally in wave (X) that terminated at $104.19. The subsequent decline in wave (Y) is now in progress, targeting the extreme blue box area between $37 and $62.60. This zone is expected to attract buyers and set the stage for the next bullish cycle continuation in alignment with the broader Elliott Wave outlook.
면책 조항: 본 게시글에 표현된 견해는 전적으로 작성자의 견해이며 Followme의 공식 입장을 대변하지 않습니다. Followme는 제공된 정보의 정확성, 완전성 또는 신뢰성에 대해 책임을 지지 않으며, 서면으로 명시적으로 언급되지 않는 한 해당 내용을 기반으로 취해진 어떠한 조치에 대해서도 책임을 지지 않습니다.

