The Magnificent Seven ETF (MAGS) tracks the performance of seven leading U.S. technology and growth companies. It offers investors concentrated exposure to some of the market’s most influential names. Since its launch, MAGS has exhibited strong directional moves that lend themselves well to Elliott Wave analysis. It has clear impulsive advances and corrective phases shaping its medium‑term trend structure.
MAGS Weekly Elliott Wave Chart
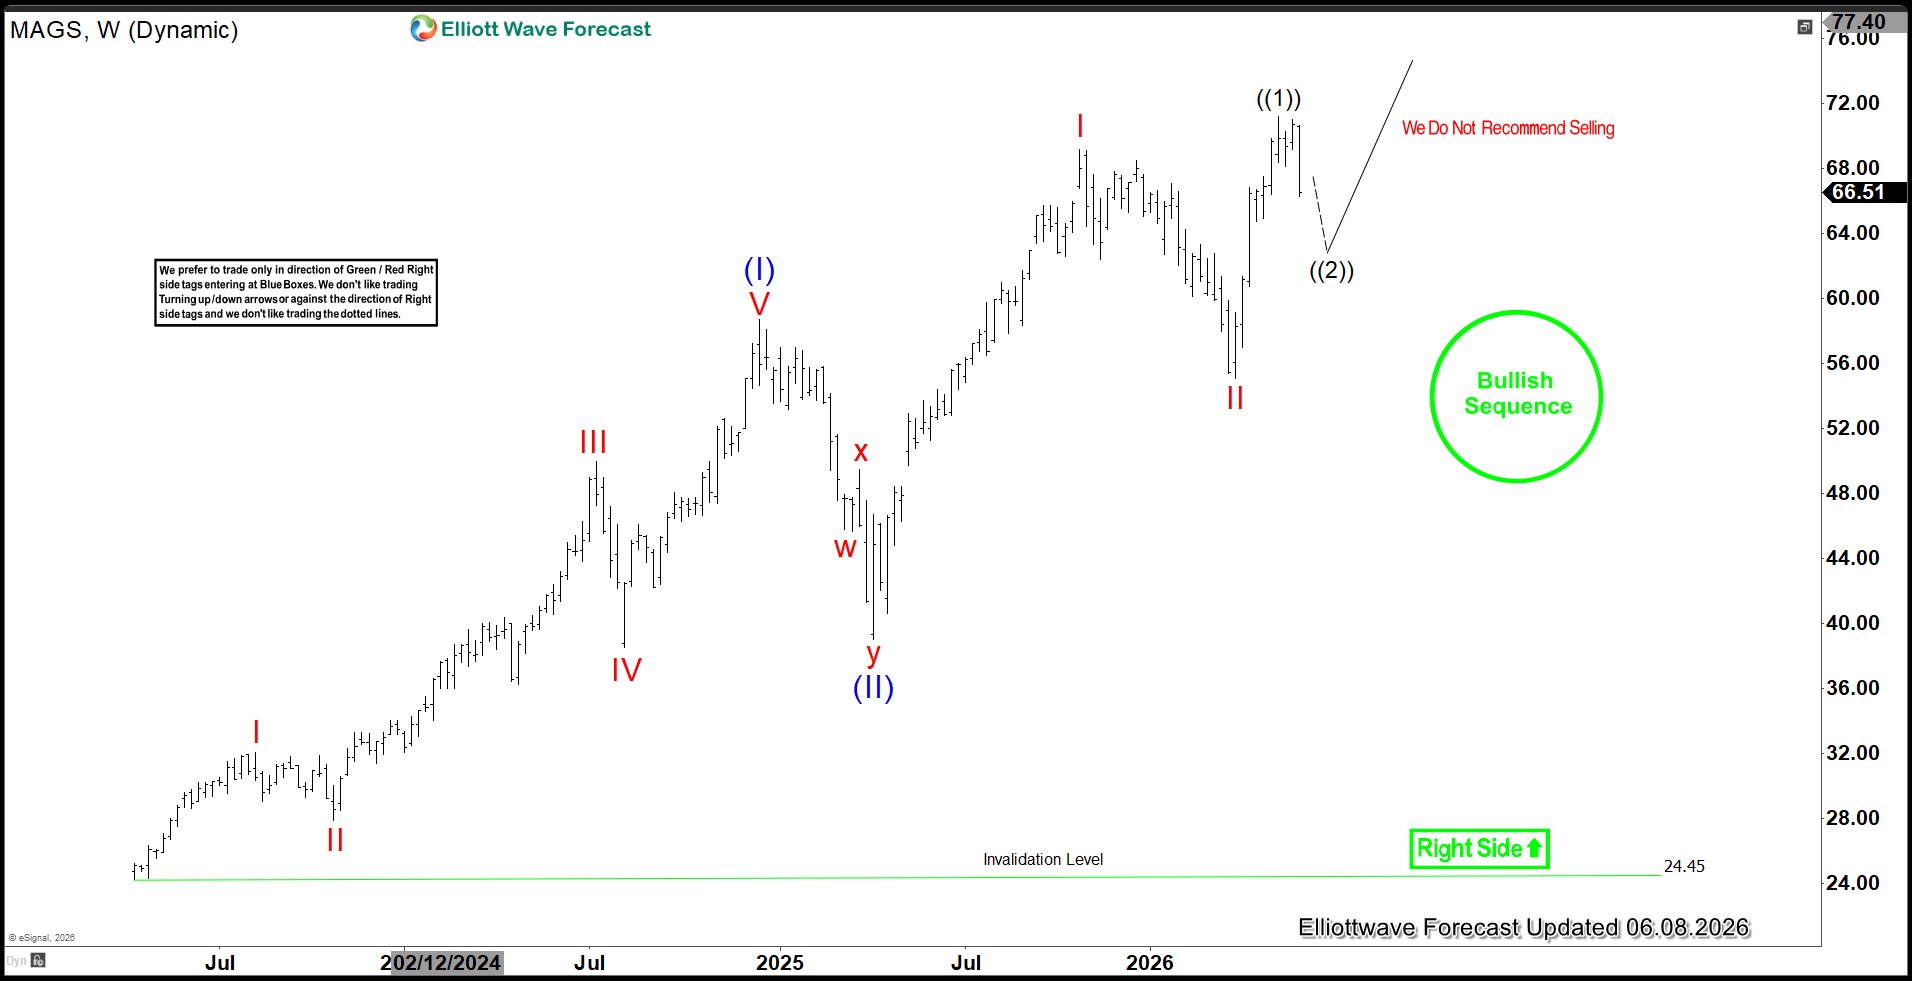
The weekly Elliott Wave view of the Magnificent Seven ETF (MAGS) shows the initial advance from its all‑time low peaking in wave (I) at $58.69 in December 2024, a move shaped by a five‑wave impulse. That rise was followed by a corrective phase, with wave (II) bottoming at $39 in April 2025. From there, the ETF launched into wave (III) as a nested progression, carrying prices to $69.14 to complete wave I. The subsequent decline in wave II found support at $55.09, setting the stage for another leg higher in wave III. Within this advance, wave ((1)) of III topped at $71.16. A pullback in wave ((2)) is now expected, working off the cycle that began from the March 30, 2026 low, before the broader uptrend resumes.
MAGS Daily Elliott Wave Chart
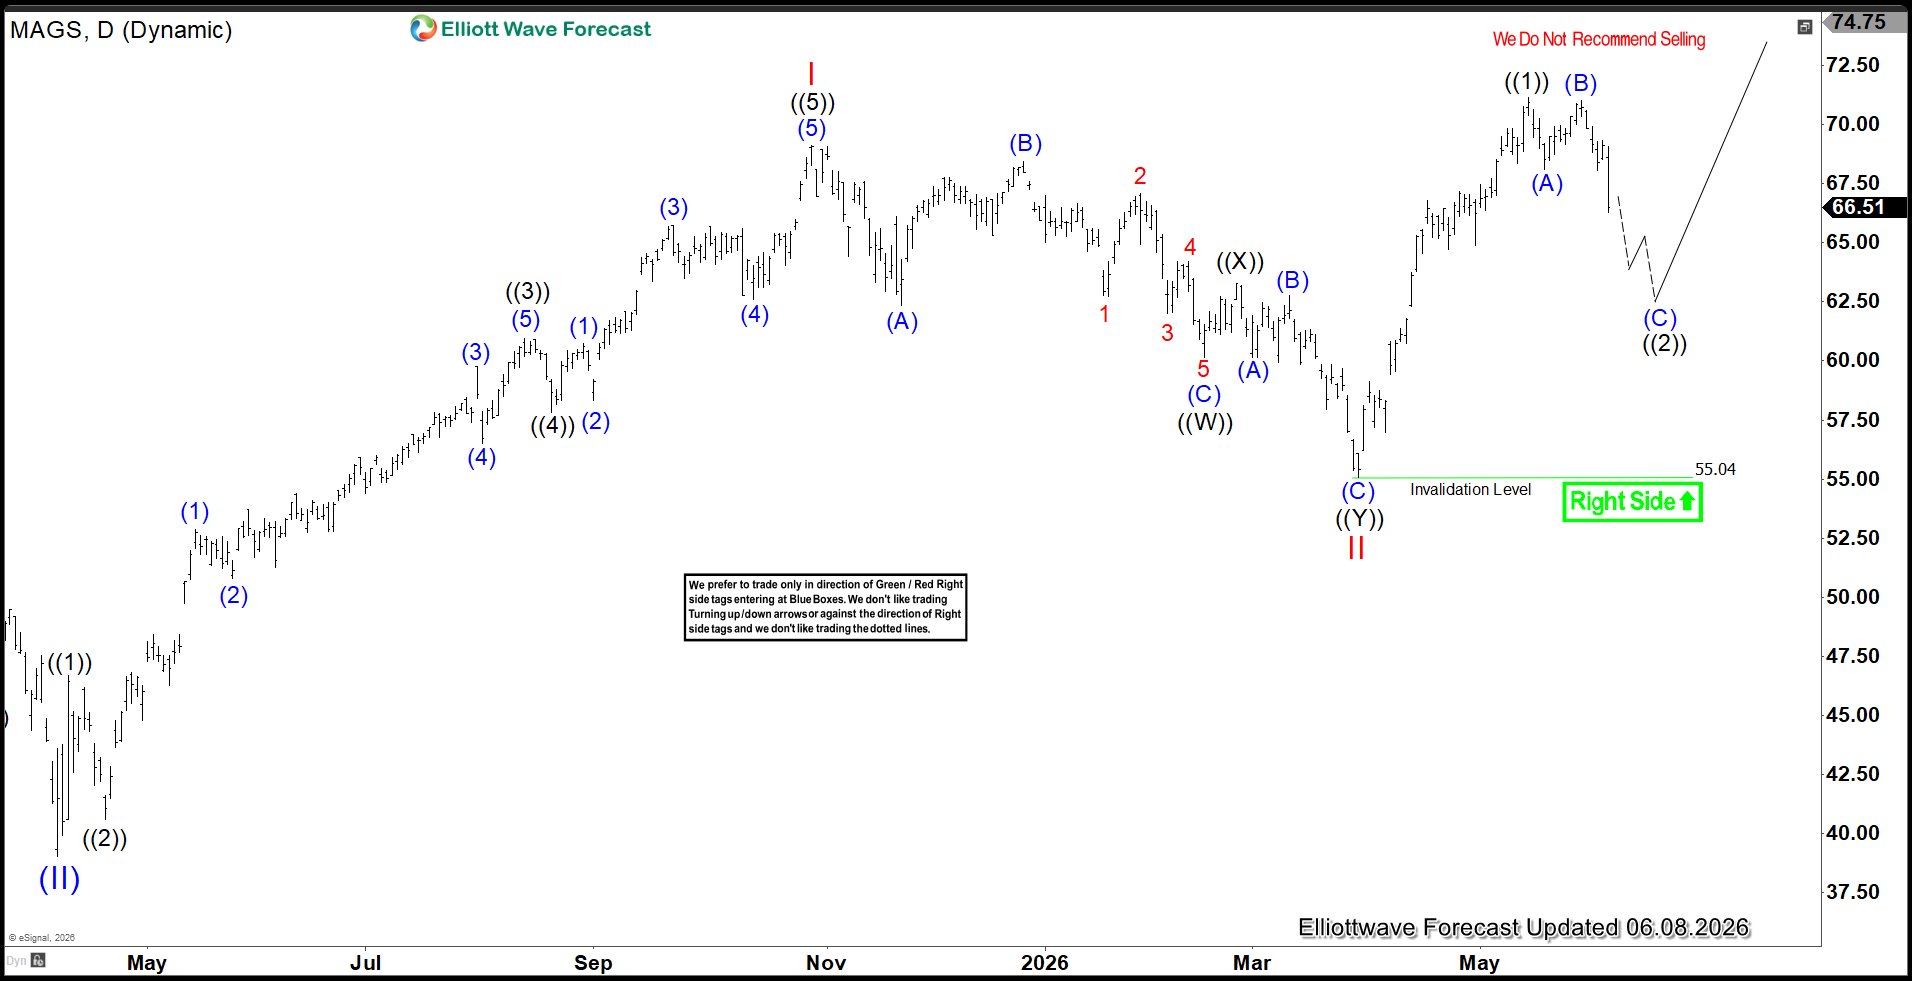
On the daily Elliott Wave chart of the Magnificent Seven ETF (MAGS), the advance from the April 2025 low carried through to wave I at $69.14. The subsequent decline in wave II found support at $55.04, after which the ETF turned higher into wave III. Within this sequence, wave ((1)) of III peaked at $71.16. The current retreat in wave ((2)) of III is unfolding as a flat correction, working off the cycle that began from the March 30, 2026 low, before the broader upward trend resumes.
면책 조항: 본 게시글에 표현된 견해는 전적으로 작성자의 견해이며 Followme의 공식 입장을 대변하지 않습니다. Followme는 제공된 정보의 정확성, 완전성 또는 신뢰성에 대해 책임을 지지 않으며, 서면으로 명시적으로 언급되지 않는 한 해당 내용을 기반으로 취해진 어떠한 조치에 대해서도 책임을 지지 않습니다.
더 오래된 의견은 없습니다. 소파를 가장 먼저 잡으십시오.