Mastercard Inc (NYSE: MA) is undergoing a weekly correction. Today, we dive into its technical chart. Our analysis explores the Elliott Wave structure and projected target for the current cycle.
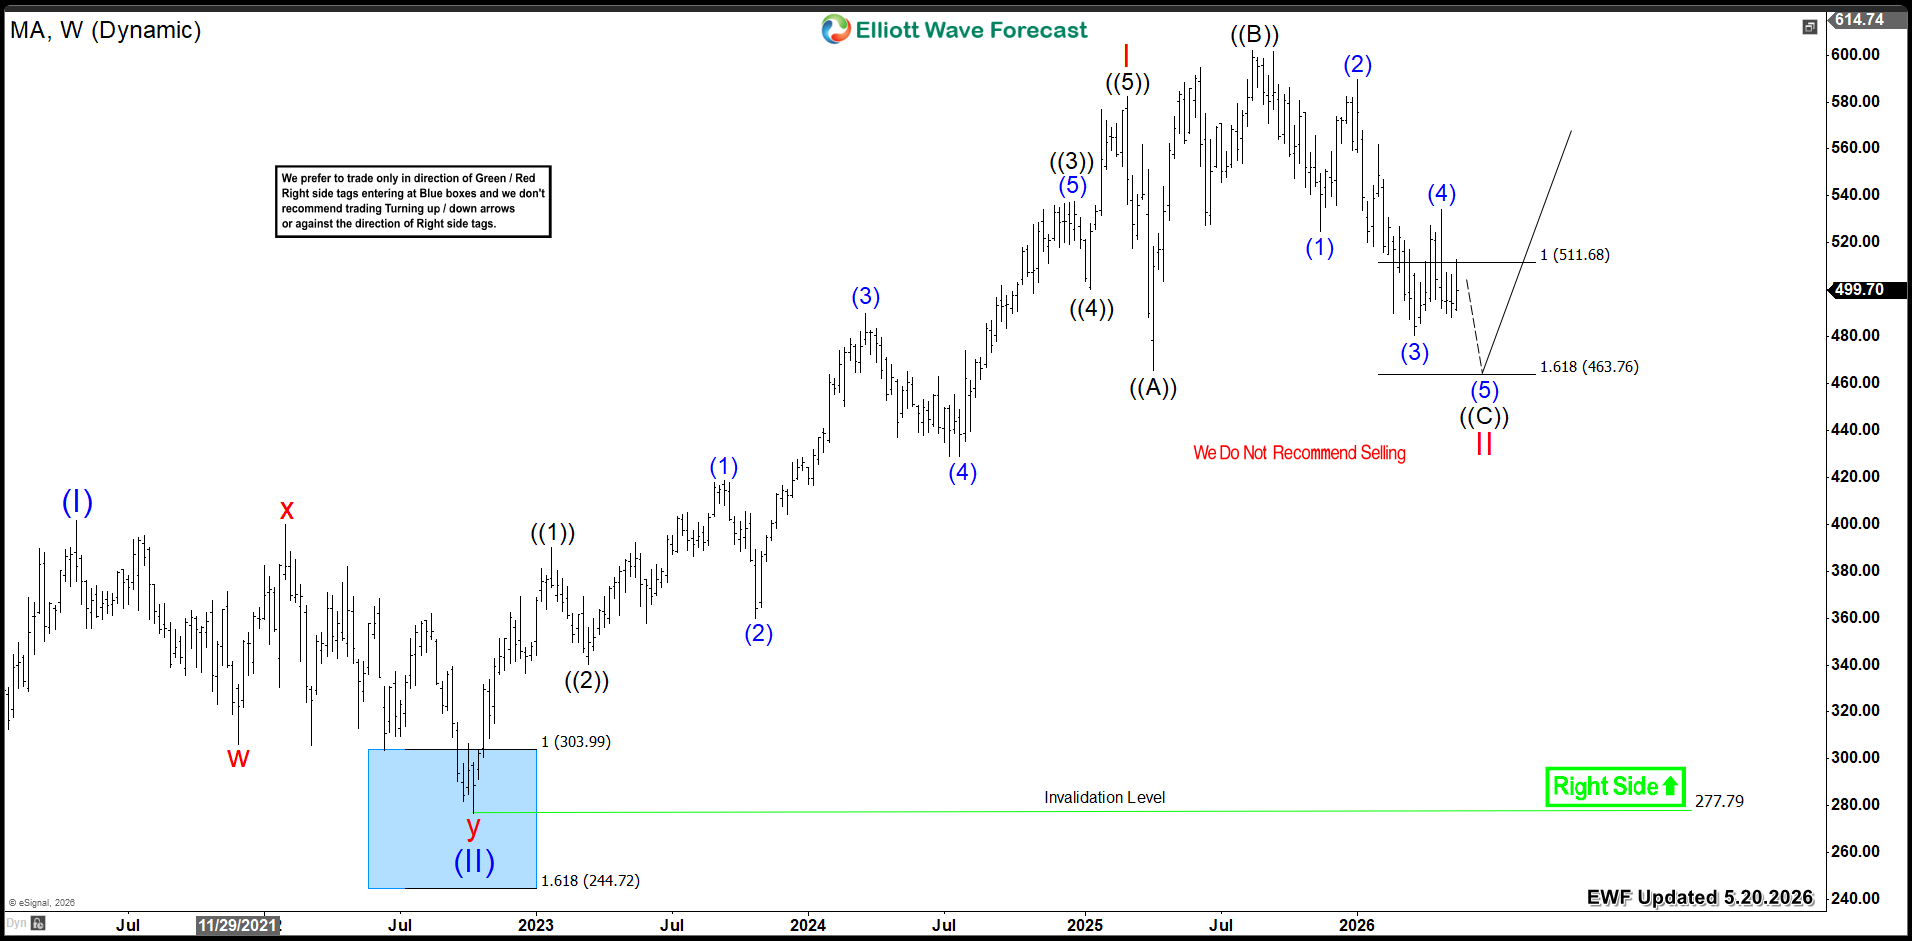
MA completed an impulsive five-wave advance from its 2022 low of 277.79. Wave I peaked at $582. From that high, a three-wave flat correction is now unfolding. Wave ((A)) ended at 465. Then, Then, wave ((B)) reached $601. Currently, wave ((C)) remains in progress.
The stock already reached the equal legs zone ( $511 − $463) . This area should conclude wave II. Consequently, a bullish reversal will take place from this zone and Mastercard will look to resume the rally higher in wave III into new all time highs.
Mastercard (MA) Weekly Chart 5.20.2026
Conclusion
Mastercard's (MA) bullish cycle remains in progress. The stock is poised for further upside extension. Therefore, investors should target buying opportunities within weekly pullbacks.
면책 조항: 본 게시글에 표현된 견해는 전적으로 작성자의 견해이며 Followme의 공식 입장을 대변하지 않습니다. Followme는 제공된 정보의 정확성, 완전성 또는 신뢰성에 대해 책임을 지지 않으며, 서면으로 명시적으로 언급되지 않는 한 해당 내용을 기반으로 취해진 어떠한 조치에 대해서도 책임을 지지 않습니다.

더 오래된 의견은 없습니다. 소파를 가장 먼저 잡으십시오.