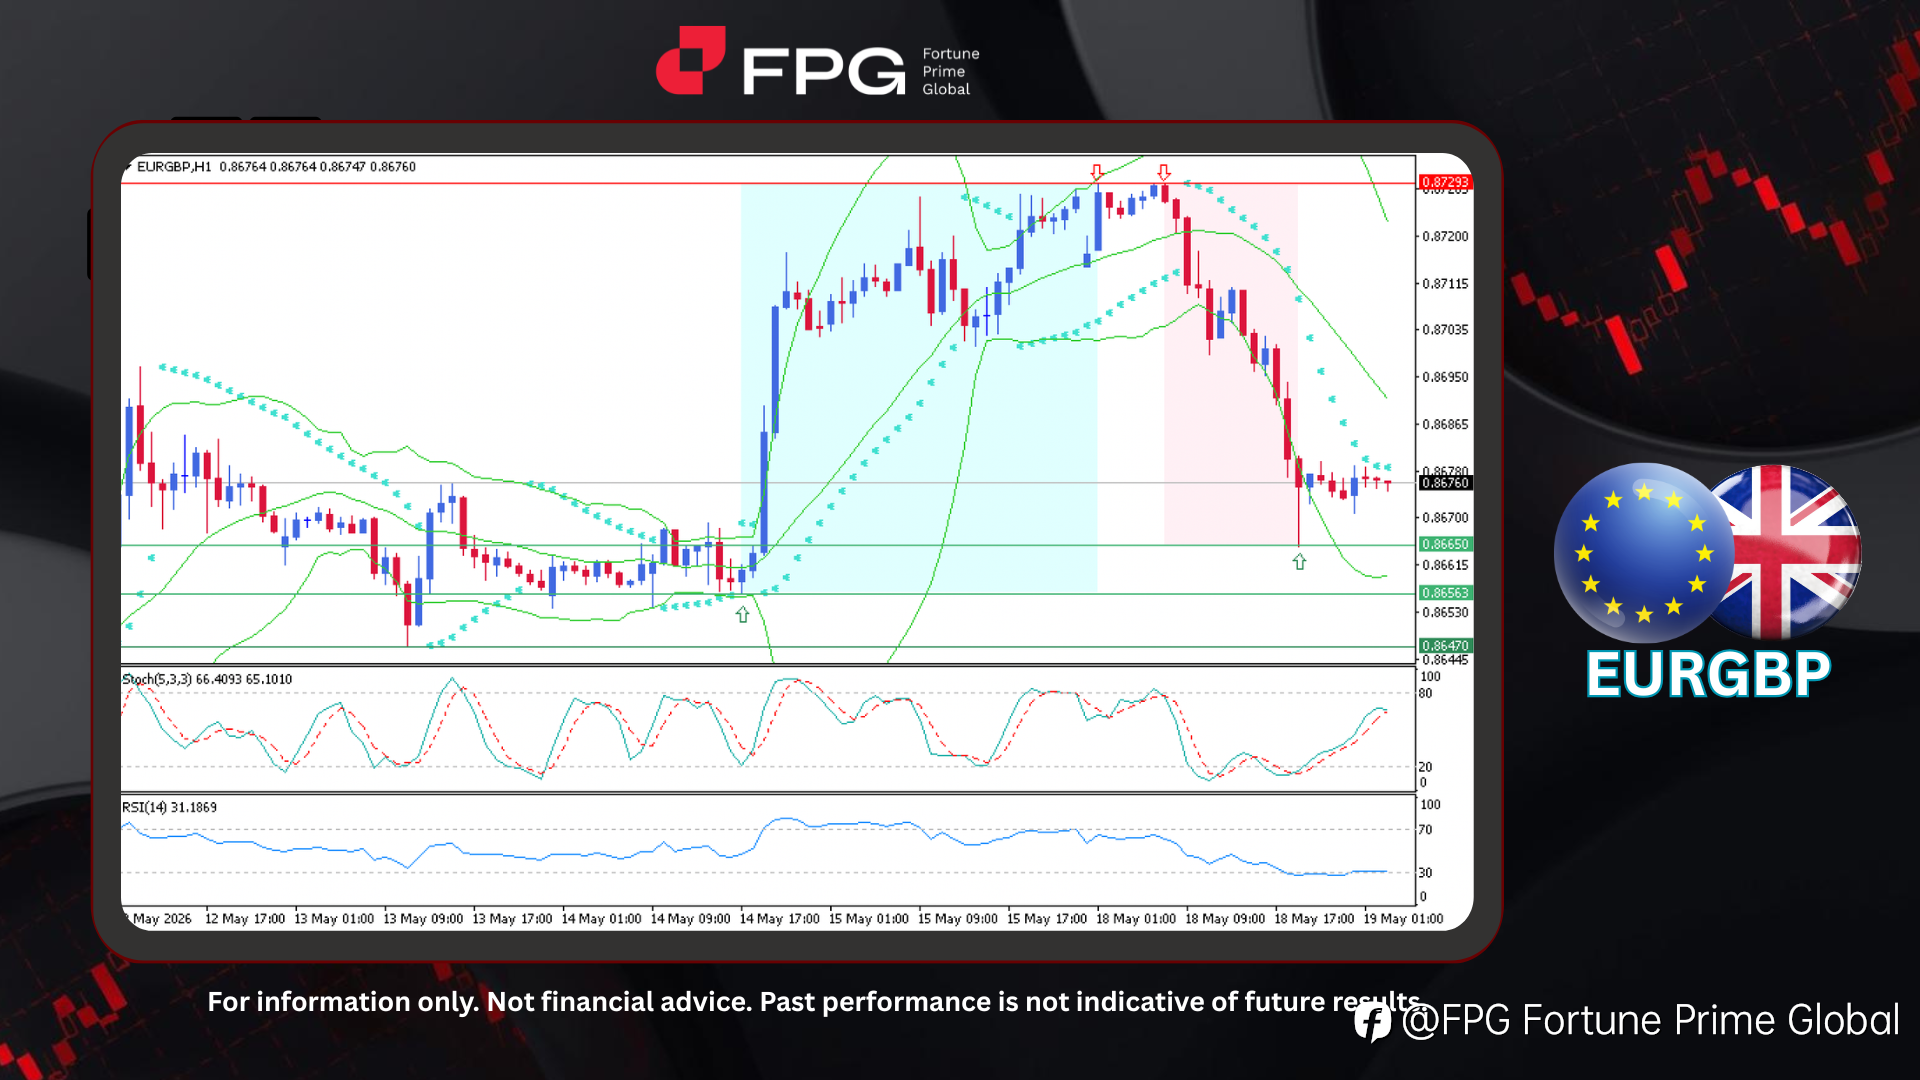
On the H1 timeframe chart, EURGBP has recently experienced a bearish price drop, falling from 0.8729 to 0.8665. Looking at the recent structure, a bullish rally previously developed last week, where the pair strengthened steadily from 0.8656 before eventually peaking at 0.8729. Around that resistance area, several rejection attempts occurred, indicating weakening buying momentum and increasing selling pressure. Following those repeated failures to continue higher, the market entered a bearish correction phase characterized by lower highs and lower lows. The current price is trading around 0.8676 with moderate volatility, while recent candles show temporary stabilization near the lower support area after the latest decline.
From a technical perspective, EURGBP is currently maintaining a short-term bearish structure after failing to sustain movement above the 0.8729 resistance zone. Price has moved below the middle Bollinger Band area, reflecting weakening bullish momentum and increasing downside pressure following the previous rally. Bollinger Bands remain moderately wide, indicating that volatility is still relatively active despite the recent stabilization phase. The Stochastic Oscillator (5,3,3) is currently around 66.40 and 65.10, showing a moderate recovery attempt after previously moving lower, although momentum remains limited and not yet strong enough to confirm a bullish reversal. Meanwhile, the RSI (14) is around 31.18, approaching oversold territory and reflecting weak buying strength after the recent selloff. Overall, current indicator conditions continue favoring bearish pressure, although oversold conditions may temporarily slow the downside movement.
Global markets have recently focused on several major economic policy developments across the UK, Eurozone, and United States. In the UK, weaker employment data, slowing consumer demand, and persistent inflation concerns increased uncertainty over the future direction of Bank of England policy. Meanwhile, the Eurozone continued to face pressure from weak industrial activity, trade uncertainty, and cautious ECB comments, while the US market reacted to renewed concerns over Federal Reserve policy and ongoing tariff tensions under President Donald Trump. These combined factors recently strengthened bearish pressure on the euro and contributed to the latest decline in EURGBP.
Technical Market Overview
1. Current Position: EURGBP is currently trading around 0.8676 after declining from the recent high at 0.8729. Price action remains under bearish pressure following multiple rejection attempts near resistance, although short-term stabilization is currently occurring near the lower support area.
2. Resistance Zone: Immediate resistance is located at 0.8695, which aligns with the recent consolidation area and short-term recovery ceiling. A stronger resistance zone is seen at 0.8729, representing the recent swing high and major rejection level that triggered the latest bearish reversal.
3. Support Zone: Nearest support is identified at 0.8665, which currently acts as the main short-term support zone following the recent decline. A deeper support zone lies around 0.8656–0.8647, representing the previous bullish base and an important structural support area.
4. Indicator Observation: Technical indicators continue reflecting a bearish short-term outlook. Bollinger Bands remain moderately wide, indicating that market volatility is still relatively active. The Stochastic Oscillator (5,3,3) is attempting to recover at 66.40 and 65.10, signaling a limited corrective rebound after the recent selloff. Meanwhile, RSI (14) remains weak around 31.18, showing that bullish momentum is still limited despite recent price stabilization.
5. Technical Summary: Overall, EURGBP remains under bearish pressure after failing to sustain bullish momentum above 0.8729. Current price stabilization near support may trigger temporary sideways movement or a minor corrective rebound, but the broader short-term structure still favors bearish continuation unless price successfully recovers above nearby resistance zones. A confirmed move below 0.8665 could reopen downside potential toward deeper support levels, while a recovery above 0.8695 may improve short-term bullish sentiment.
Market Performance:
Forex Last Price % Change
EUR/USD 1.1653 −0.02%
USD/JPY 158.92 +0.09%
Today’s Key Economic Calendar:
US: Net Long-term TIC Flows
JP: GDP Growth Annualized & Rate QoQ Preliminary
AU: RBA Hunter Speech
AU: Westpac Consumer Confidence Change & Index
AU: RBA Meetings Minutes
UK: Average Earnings incl. Bonus (3Mo/Yr)
UK: Employment Change
UK: Unemployment Rate
EU: Balance of Trade
CN: FDI (YTD) YoY
UK: BoE Breeden Speech
US: ADP Employment Change Weekly
CA: Core Inflation Rate YoY
CA: Inflation Rate MoM & YoY
CA: New Housing Price Index MoM
US: Fed Waller Speech
US: Pending Home Sales MoM & YoY
Risk Disclaimer: This report is for informational purposes only and does not constitute financial advice. Investments involve risks, and past performance does not guarantee future results. Consult your financial advisor for personalized investment strategies.
#FPG-FortunePrimeGlobal# #trading# #FX# #Todayanalysis# #NewTraders#
면책 조항: 본 게시글에 표현된 견해는 전적으로 작성자의 견해이며 Followme의 공식 입장을 대변하지 않습니다. Followme는 제공된 정보의 정확성, 완전성 또는 신뢰성에 대해 책임을 지지 않으며, 서면으로 명시적으로 언급되지 않는 한 해당 내용을 기반으로 취해진 어떠한 조치에 대해서도 책임을 지지 않습니다.

