


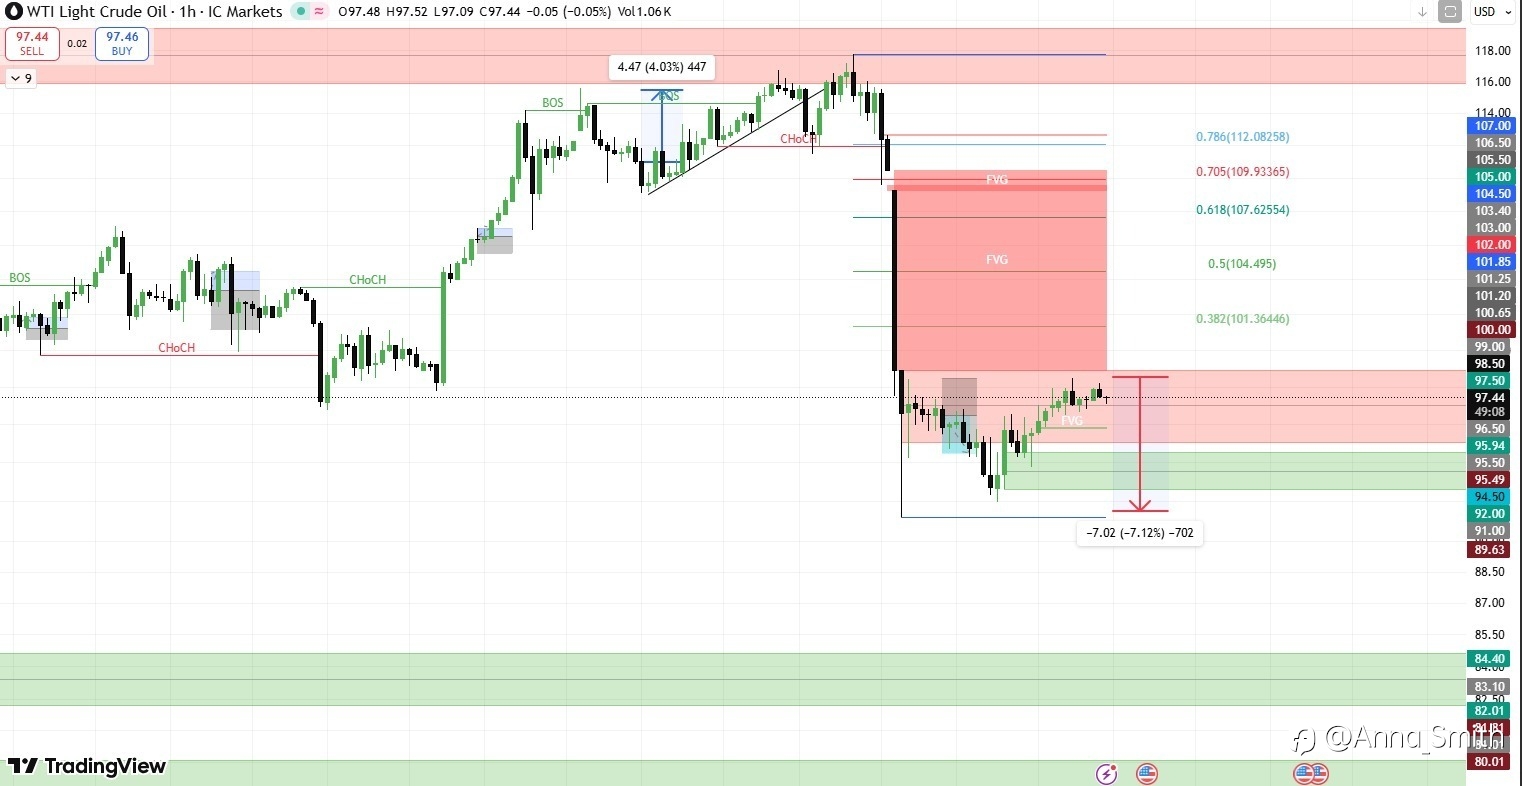
WTI just had a pretty strong sell-off, and the move down was fast and aggressive. When the market drops like that, it usually leaves some imbalances (FVGs) behind, which often pull price back before the next move.
Right now price seems to be stabilizing around the 95–97 area, but there’s still a noticeable imbalance above that could attract a pullback if buyers step in.
What I’m watching right now:
• A possible retracement into the FVG / supply area where sellers might step in again.
• Or if the bearish momentum continues, we could see another move down toward the 94–92 zone.
Moves like this rarely go straight in one direction, so a bounce before the next leg wouldn’t be surprising.
Just sharing my perspective on the chart — always interesting to hear how others are reading it.
What do you think?
Do you expect a pullback first, or more downside from here?
If you enjoy simple chart breakdowns like this, feel free to follow my profile. I share trading ideas and market observations regularly.
면책 조항: 본 게시글에 표현된 견해는 전적으로 작성자의 견해이며 Followme의 공식 입장을 대변하지 않습니다. Followme는 제공된 정보의 정확성, 완전성 또는 신뢰성에 대해 책임을 지지 않으며, 서면으로 명시적으로 언급되지 않는 한 해당 내용을 기반으로 취해진 어떠한 조치에 대해서도 책임을 지지 않습니다.

