


In this Elliott Wave update, the latest structure in Nike Inc. ($NKE) is being reviewed. A larger bearish sequence continues to be seen, and the stock remains under pressure within a grand super cycle correction.
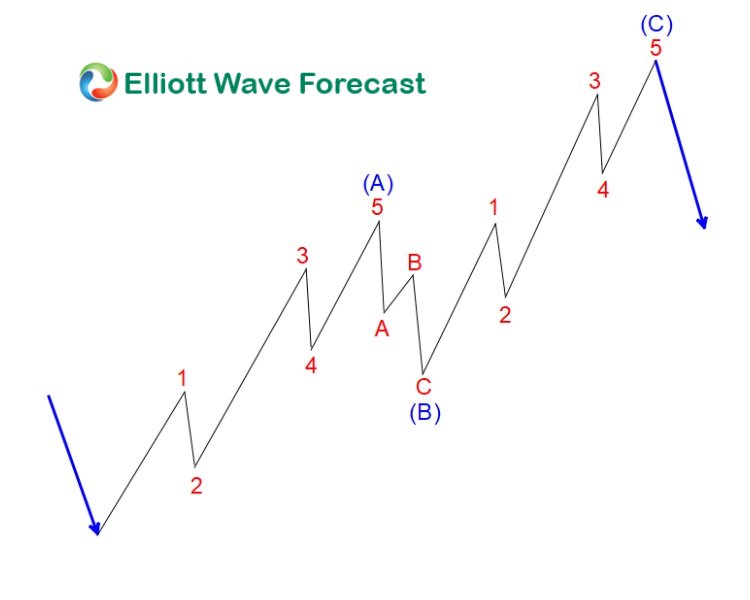
ABC correction
$NKE 1H Elliott Wave Chart 3.24.2026:
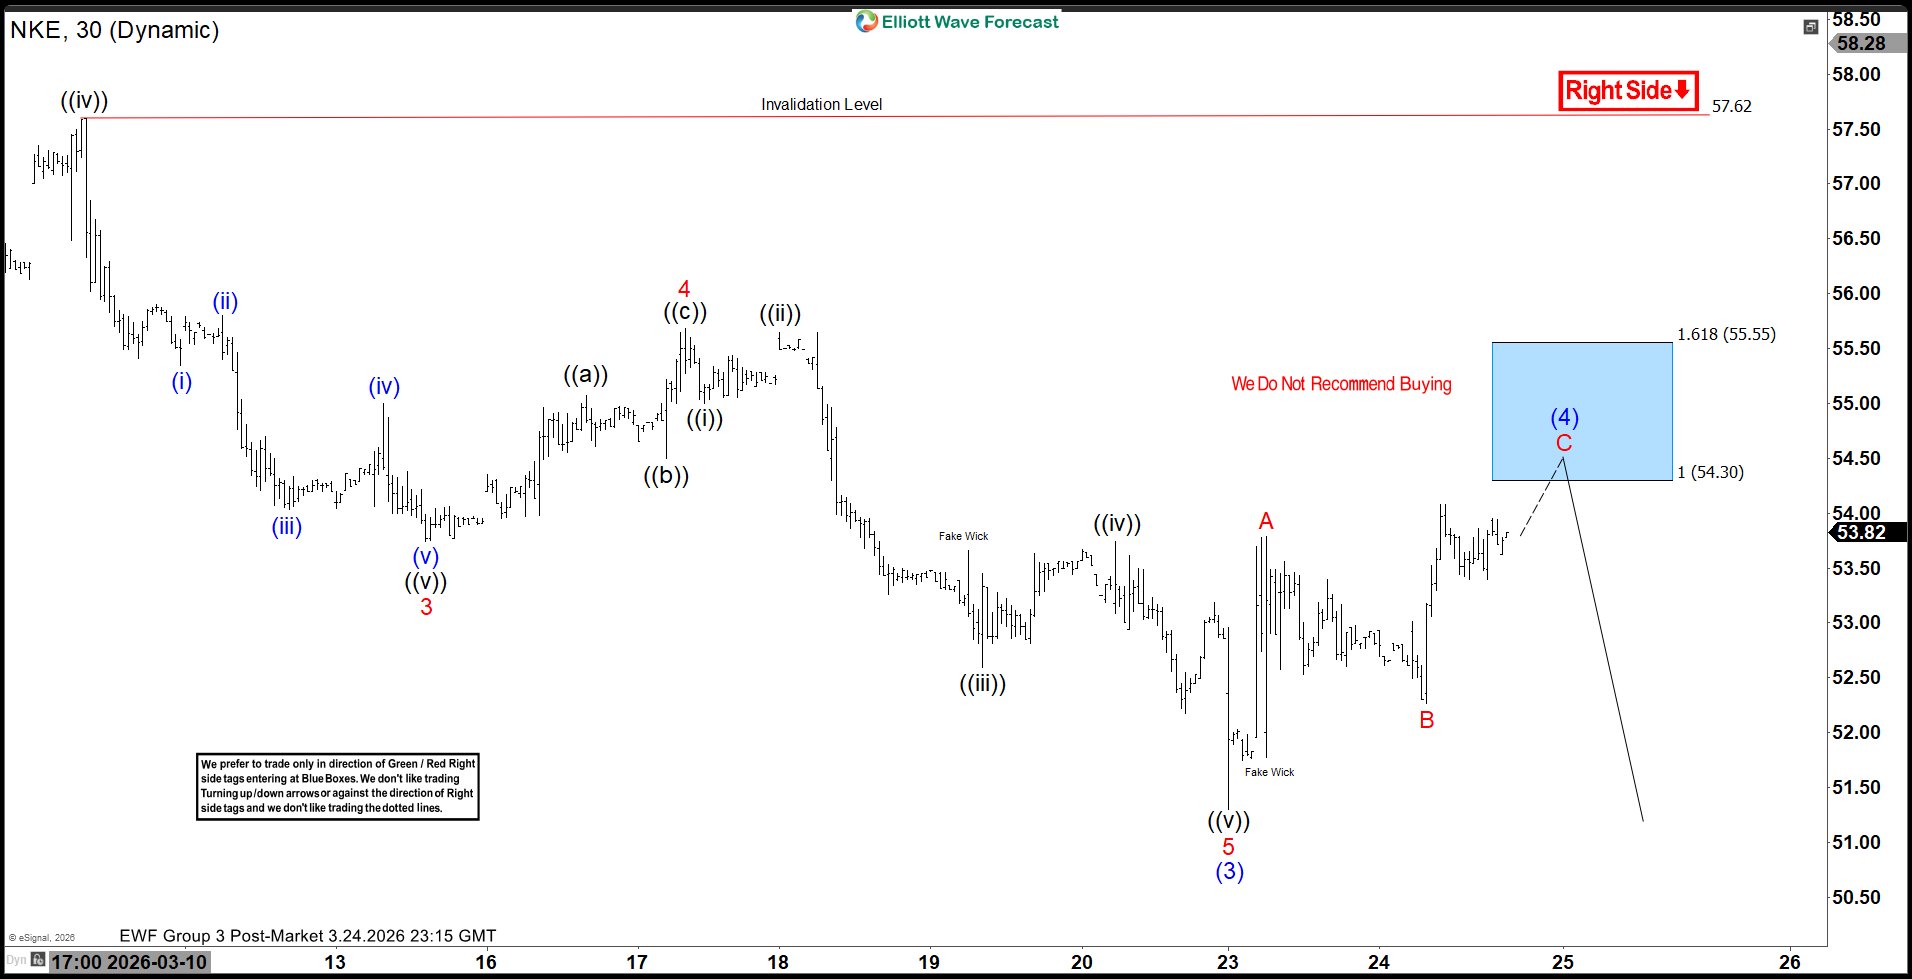
On the current chart, a decline appears to have been completed in wave (3), and a bounce in wave (4) is now being projected. This rebound is being counted as an A-B-C corrective structure. In other words, the current recovery is not being viewed as impulsive strength, but rather as a temporary rally before another leg lower unfolds.
Furthermore, the projected wave C of (4) is expected to reach the blue box area between 54.30 and 55.55. This region has been defined as the next high-frequency reaction zone, where sellers are likely to reappear.
$NKE 1H Elliott Wave Chart 4.01.2026:
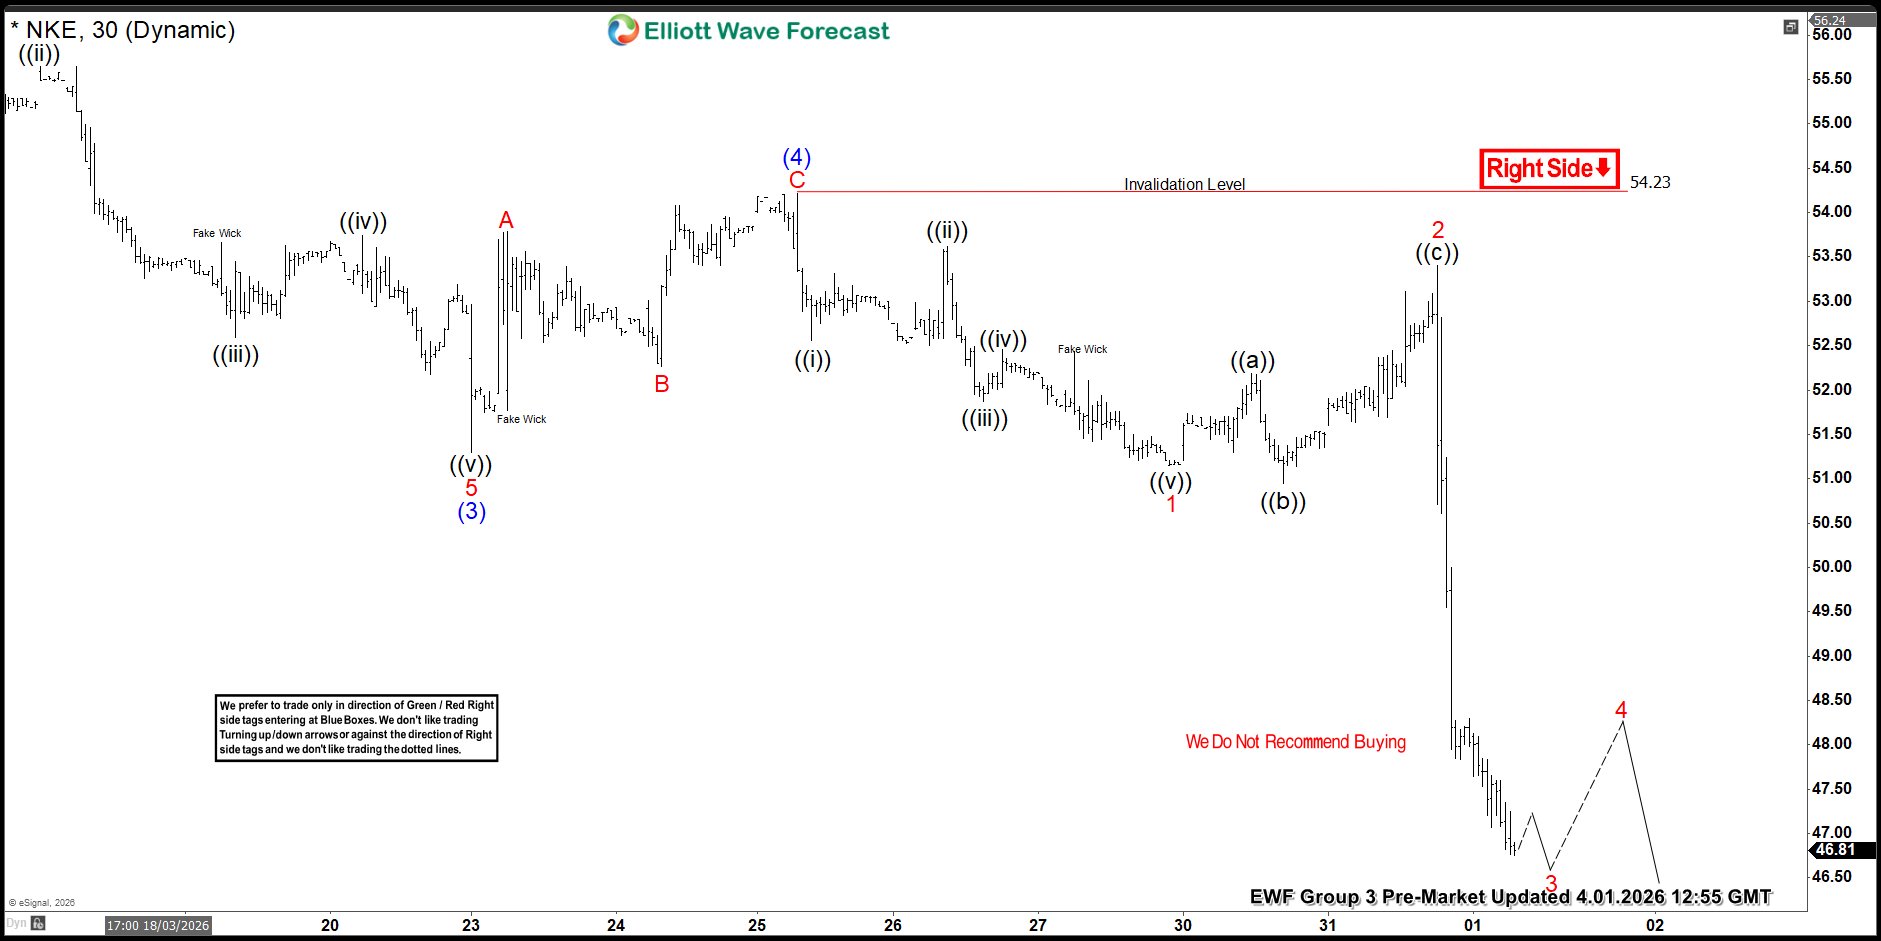
The latest update, from Apr 01, 2026, shows the stock selling as predicted. Currently, it is trading lower in wave 3 of (5) looking for continuation lower towards 45 area.
Summary
To summarize, $NKE remains in a grand super cycle correction, and bounces are being viewed as corrective, with the 45 area being targeted as the next major downside objective.
By applying the principles of Elliott Wave Theory, traders can gain a deeper understanding of market cycles, better anticipate the structure of upcoming moves, and ultimately enhance their risk management strategies in dynamic markets like the current one for $NKE.
면책 조항: 본 게시글에 표현된 견해는 전적으로 작성자의 견해이며 Followme의 공식 입장을 대변하지 않습니다. Followme는 제공된 정보의 정확성, 완전성 또는 신뢰성에 대해 책임을 지지 않으며, 서면으로 명시적으로 언급되지 않는 한 해당 내용을 기반으로 취해진 어떠한 조치에 대해서도 책임을 지지 않습니다.

