


In this technical blog, we will look at the past performance of the 4-hour Elliott Wave Charts of Bitcoin. In which, the decline from 14 January 2026 high ended 5 waves in an impulse sequence and showed a lower low sequence in a corrective pattern. Therefore, we knew that the structure of Bitcoin is incomplete to the downside & should see more weakness. So, we advised members to sell the bounces in 3, 7, or 11 swings at the blue box areas. We will explain the structure & forecast below:
Bitcoin 4-Hour Elliott Wave Chart From 3.02.2026
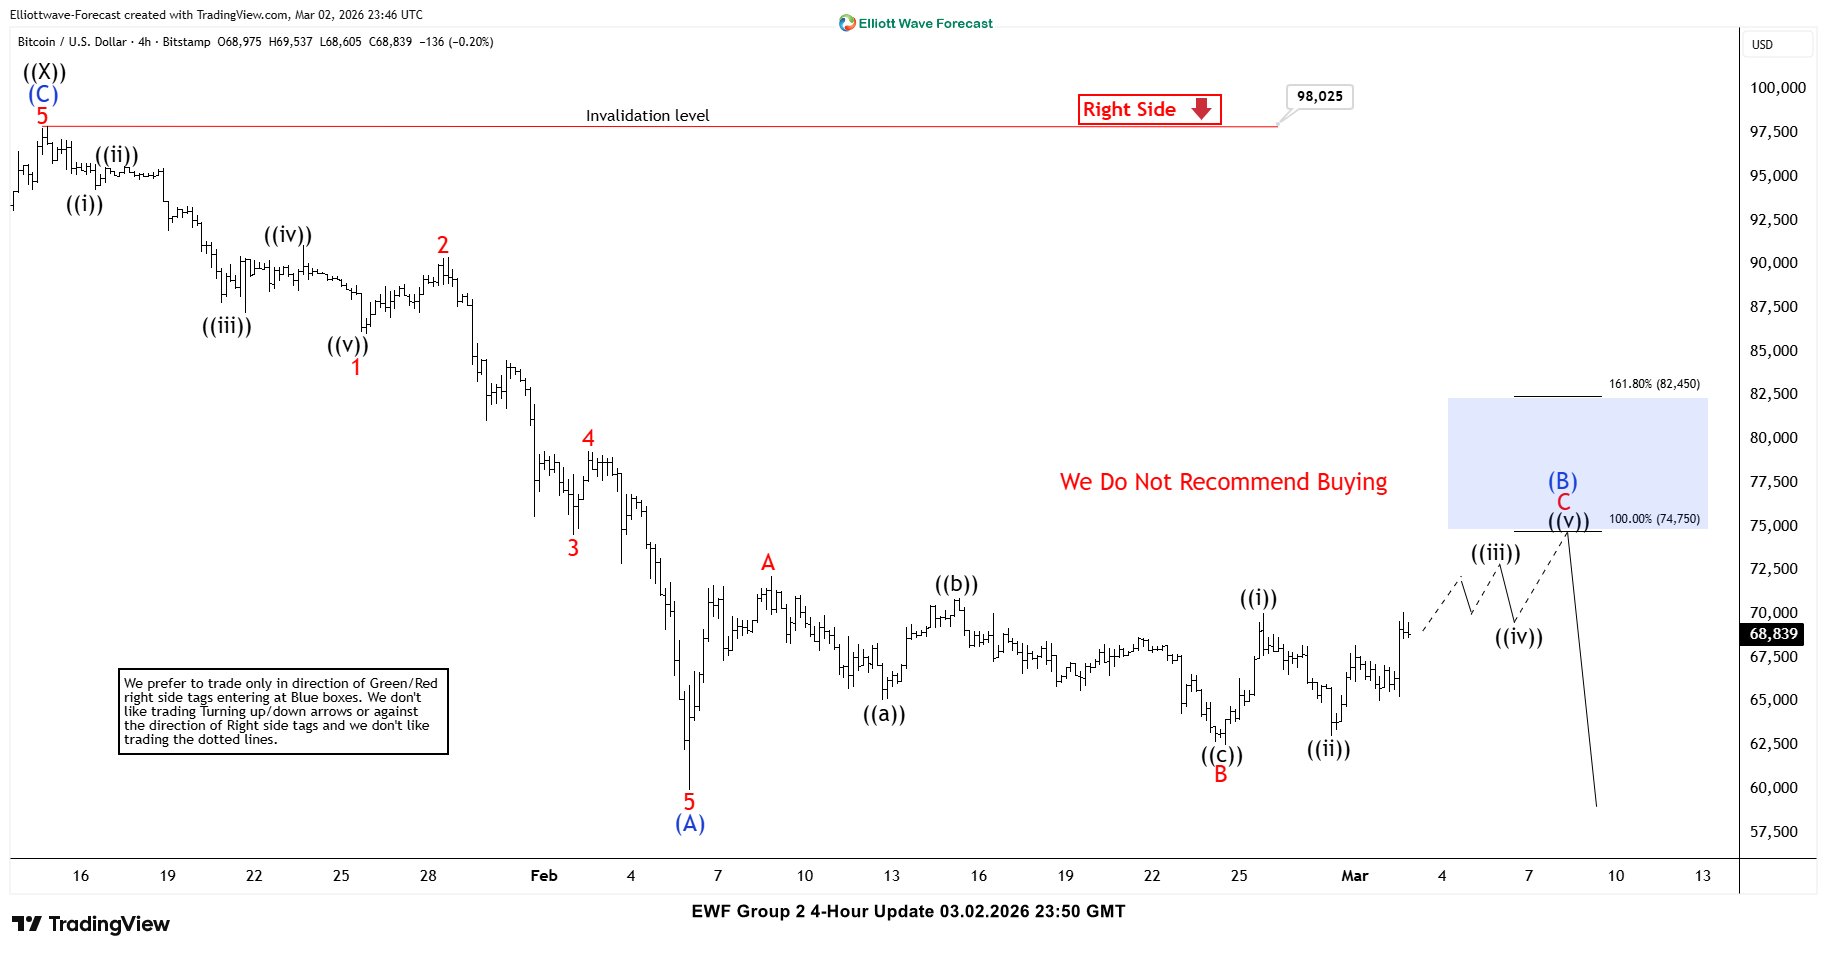
Here’s 4-hour Elliott wave Chart from the 3.02.2026 update. In which, the decline to $59930 low ended 5 waves from the 1.14.2026 high within wave (A) & made a wave (B) bounce. The internals of that bounce unfolded as an Elliott wave zigzag correction where wave A ended at $72174 high. Then a decline to $62525 ended wave B pullback and started the C leg higher towards $74750- $82450 blue box area from where sellers were expected to appear looking for more downside or for a 3 wave reaction lower at least.
Bitcoin Latest 4-Hour Elliott Wave Chart From 3.24.2026
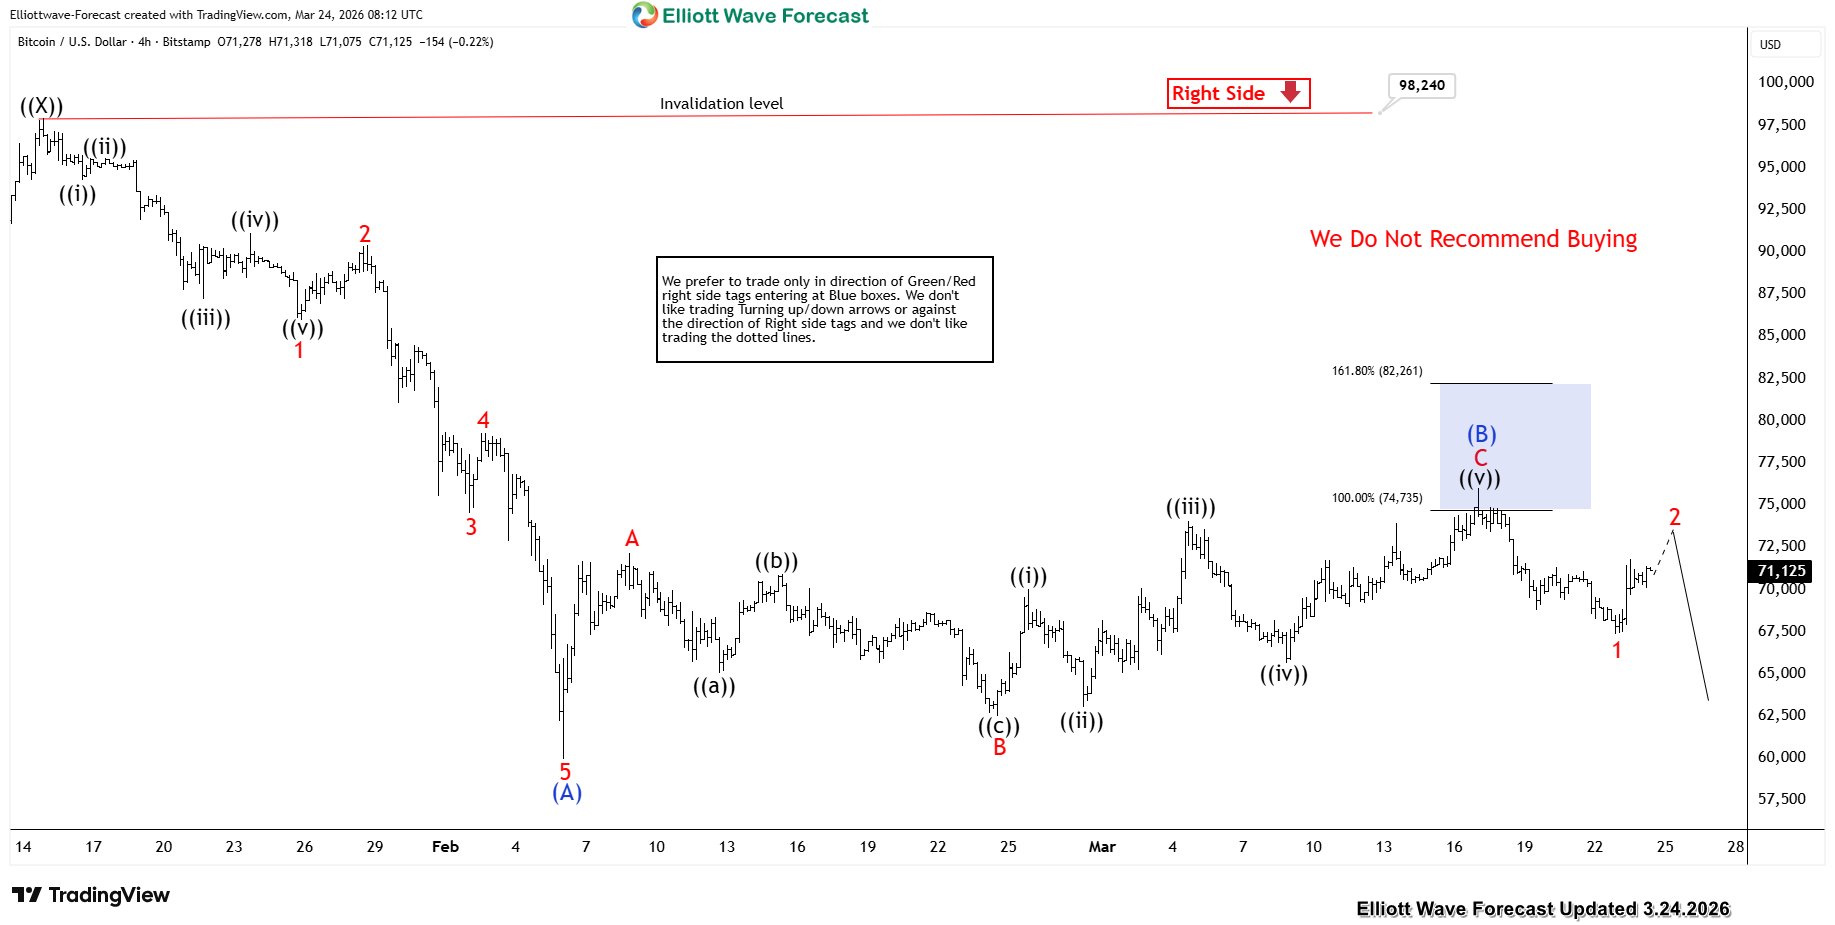
This is the Latest 4-hour view from the 3.24.2026 update. In which the BTCUSD is showing a strong reaction lower taking place from the equal legs area allowing shorts to get into a risk-free position shortly after taking the position.
면책 조항: 본 게시글에 표현된 견해는 전적으로 작성자의 견해이며 Followme의 공식 입장을 대변하지 않습니다. Followme는 제공된 정보의 정확성, 완전성 또는 신뢰성에 대해 책임을 지지 않으며, 서면으로 명시적으로 언급되지 않는 한 해당 내용을 기반으로 취해진 어떠한 조치에 대해서도 책임을 지지 않습니다.

