


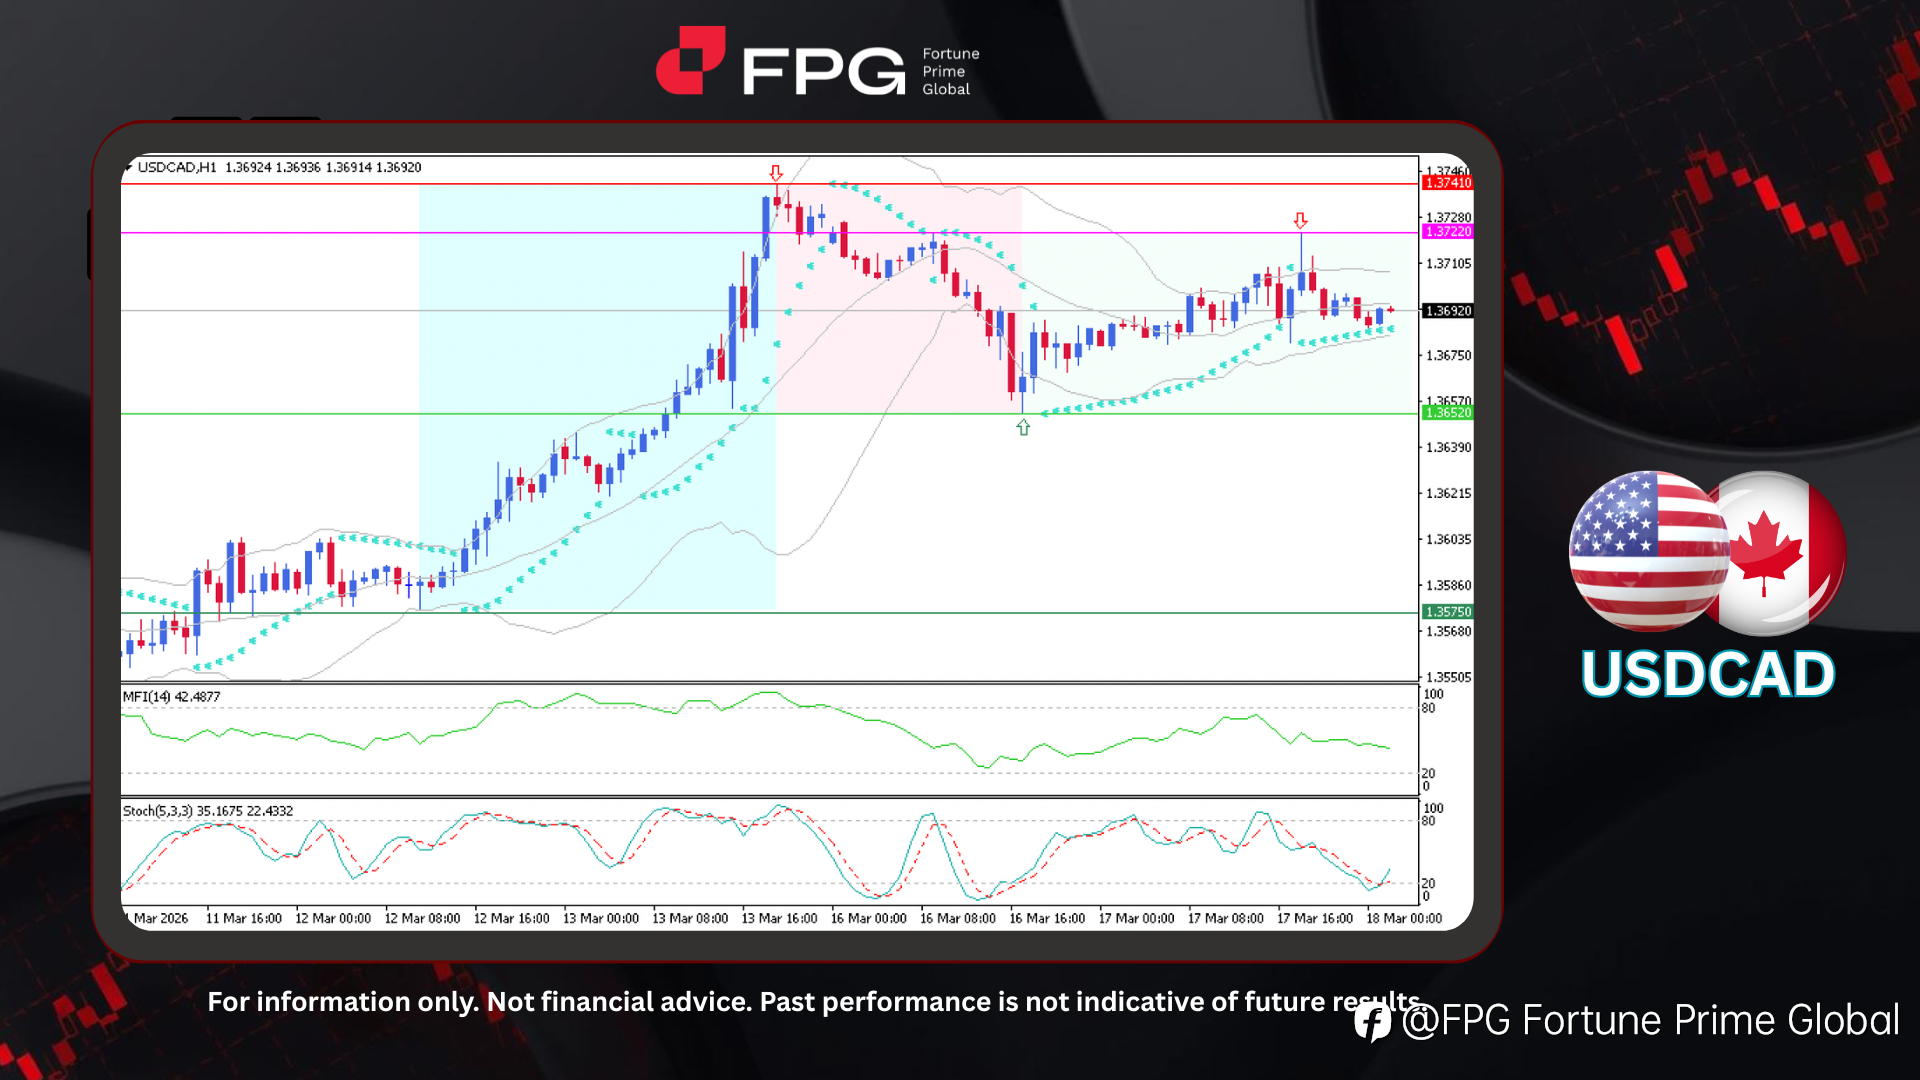
On the H1 chart, USDCAD initially experienced a strong bullish rally from 1.3575 to 1.3741, highlighting solid short-term buying momentum. After reaching this peak, the pair faced clear price rejection, triggering a corrective decline toward 1.3652. Currently, the price is hovering around 1.3692, showing moderate volatility with sideways movement, suggesting the market is entering a consolidation phase following recent sharp swings and directional shifts.
Technical indicators show a mix of short-term caution and a moderate bullish bias. Bollinger Bands are contracting, suggesting decreasing volatility and a potential range-bound phase. The Money Flow Index (MFI) is around 42, indicating neutral money flow without strong buying or selling pressure. Meanwhile, the Stochastic Oscillator is in the 20–40 range and shows a slight upward turn, hinting at potential short-term support and minor bullish attempts, although the overall movement remains largely sideways.
Recent news points to weaknesses in the Canadian economy, including job losses and rising unemployment. Despite these headwinds, USDCAD has remained relatively stable in the short term, reflecting balanced market sentiment. The Canadian dollar receives intermittent support from rising oil prices, while safe-haven demand for the USD occasionally pushes the pair higher. Weak trade data and mixed economic signals have limited sharp price movements, keeping the pair range-bound. Overall, USDCAD continues to exhibit short-term stability amid mixed Canadian economic indicators and steady USD demand.
Technical Market Overview
1. Current Position: Price is trading around 1.3692, consolidating within a sideways range after the rejection from 1.3741.
2. Resistance Zone: Key resistance is seen at 1.3722-1.3741, marking recent highs and strong rejection levels.
3. Support Zone: Immediate support lies at 1.3652, with deeper support near 1.3575.
4. Indicator Observation: Bollinger Bands are contracting, indicating declining volatility and a potential range-bound market. The Money Flow Index (MFI) remains near 42, reflecting neutral market participation without strong directional pressure. The Stochastic Oscillator is in the 20–40 zone and turning slightly upward, suggesting early signs of short-term buying interest.
5. Technical Summary: The market is consolidating after a bullish move, reflecting a temporary pause in momentum. A slight upward bias remains, supported by early signs of buying interest. The next directional move will likely depend on a breakout above resistance or a breakdown below support.
Market Performance:
Forex Last Price % Change
EUR/USD 1.1541 +0.01%
USD/JPY 158.89 −0.05%
Today’s Key Economic Calendar:
US: API Crude Oil Stock Change
JP: Balance of Trade
JP: Exports YoY
CN: FDI (YTD) YoY
US: MBA 30-Year Mortgage Rate
US: Core PPI MoM
US: PPI MoM
CA: BoC Interest Decision
US: Factory Orders MoM
CA: BoC Press Conference
US: EIA Crude Oil & Gasoline Stocks Change
Risk Disclaimer: This report is for informational purposes only and does not constitute financial advice. Investments involve risks, and past performance does not guarantee future results. Consult your financial advisor for personalized investment strategies.
면책 조항: 본 게시글에 표현된 견해는 전적으로 작성자의 견해이며 Followme의 공식 입장을 대변하지 않습니다. Followme는 제공된 정보의 정확성, 완전성 또는 신뢰성에 대해 책임을 지지 않으며, 서면으로 명시적으로 언급되지 않는 한 해당 내용을 기반으로 취해진 어떠한 조치에 대해서도 책임을 지지 않습니다.

