


The Global X Uranium ETF (URA) offers investors diversified exposure to companies engaged in uranium mining and nuclear component production, making it a key vehicle for those looking to participate in the nuclear energy transition. In this article, we will explore the long term technical outlook using Elliott Wave.
URA Elliott Wave Chart Monthly Chart
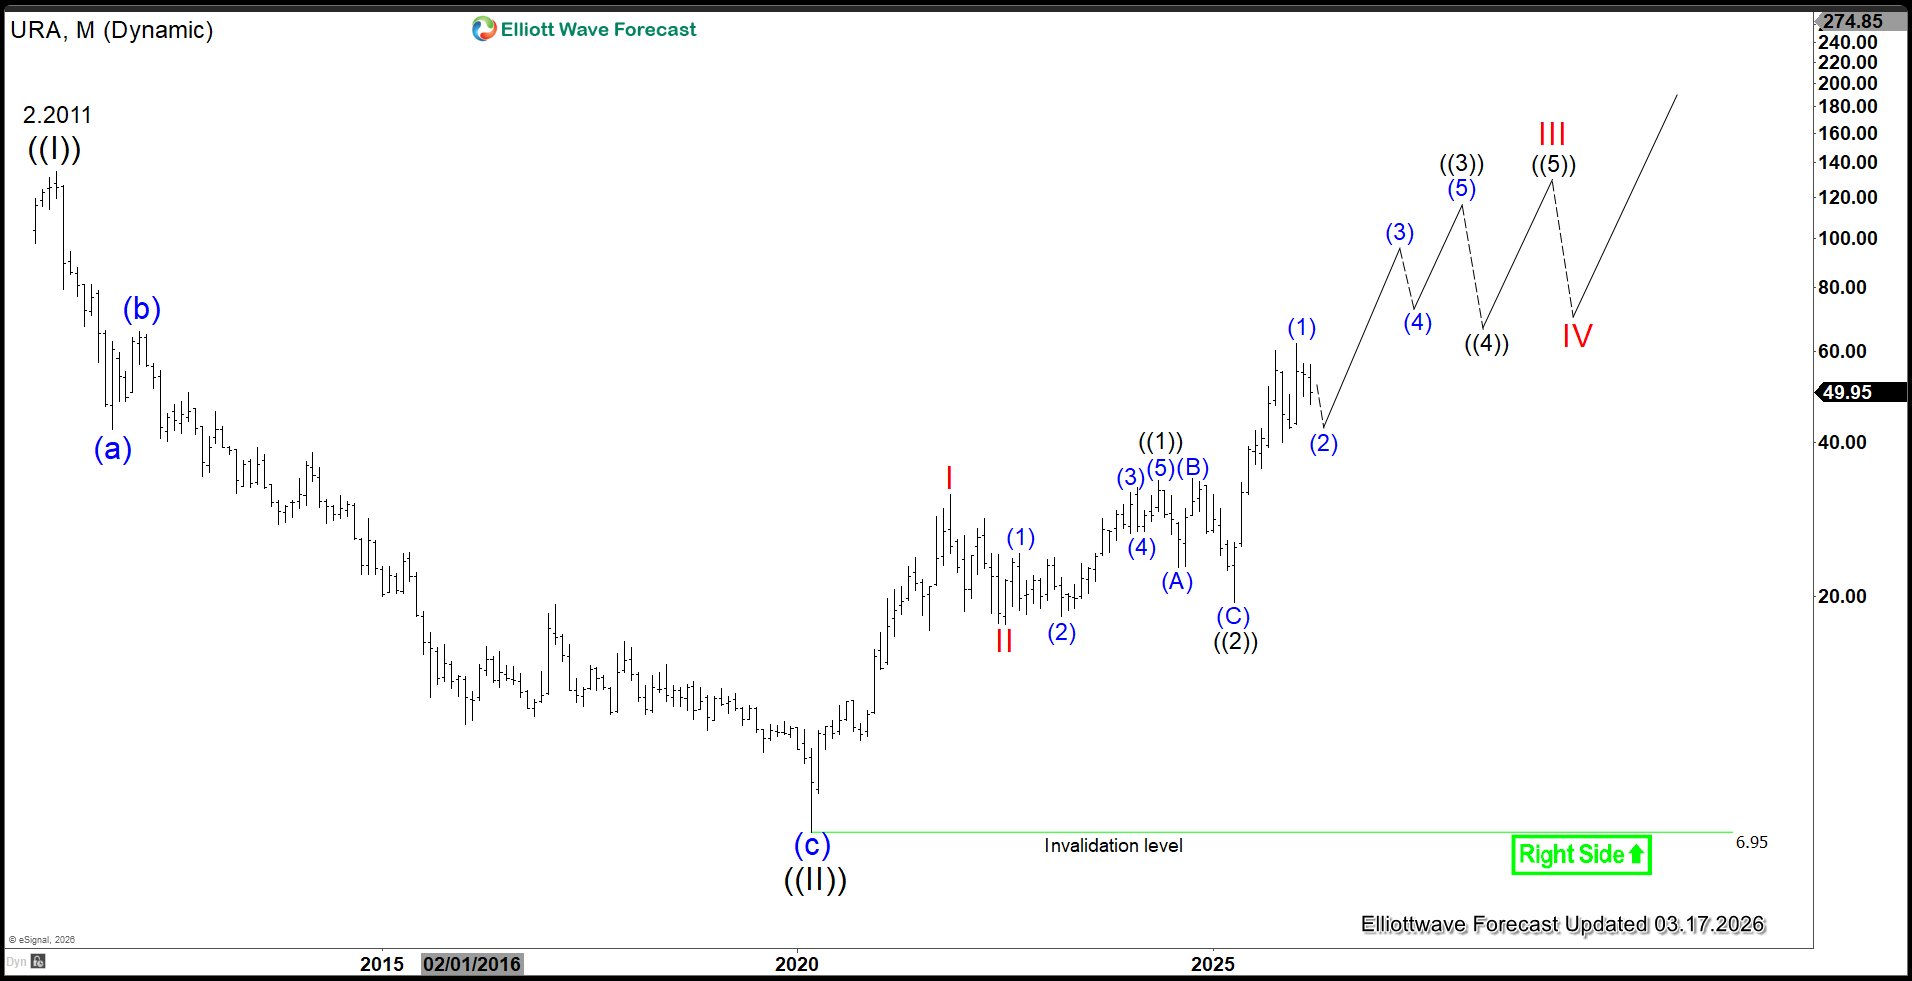
The monthly Elliott Wave chart of Uranium Miners ETF (URA) above shows that it has ended wave ((II)) grand super cycle degree at $6.95. It has started a new bullish leg in wave ((3)) with internal subdivision as a 5 waves impulse. Up from wave ((II)), wave I ended at $31.6 and wave II ended at $17.65. The ETF then nested higher with wave ((1)) ended at $33.66 and wave ((2)) ended at $19.5. While pivot at $6.95 low stays intact, expect pullback to find buyers in 3 or 7 swing for further upside.
URA Daily Elliott Wave Chart
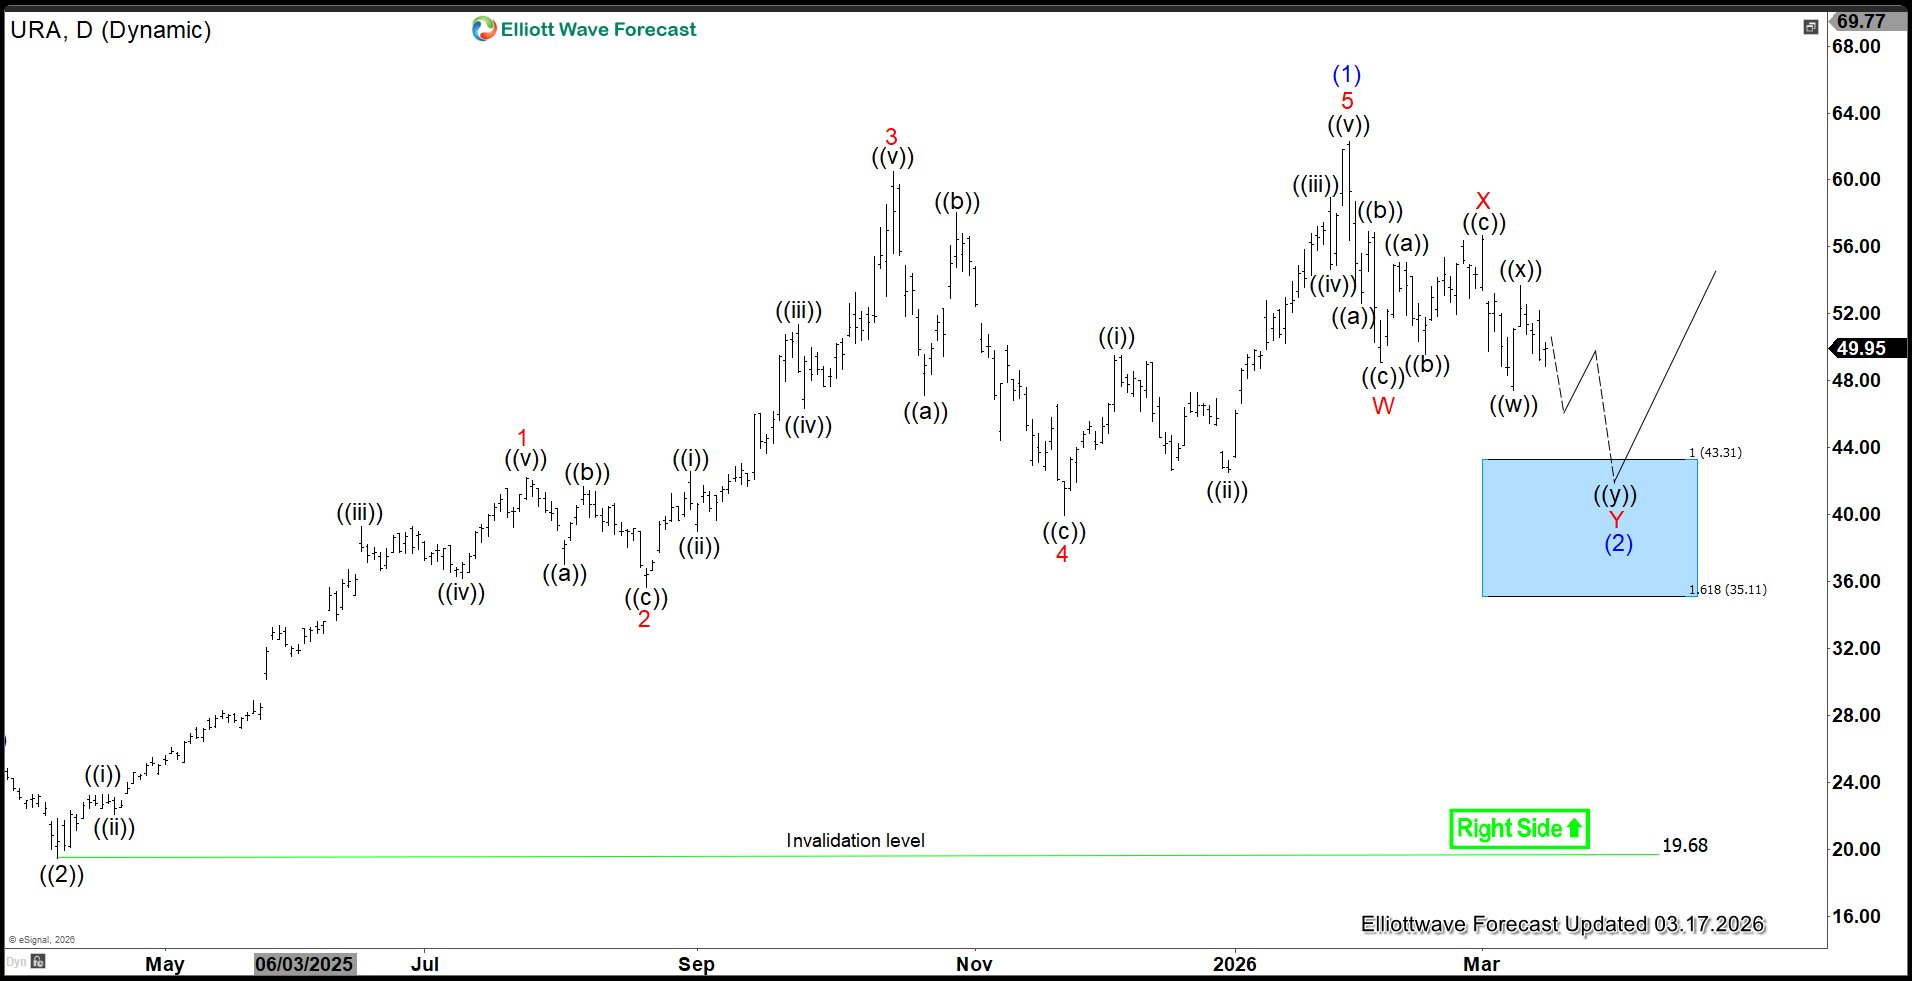
The daily chart of the Uranium ETF shows that the rally from the wave ((2)) low on April 7, 2025, concluded with wave (1) at $62.28, forming a five‑wave diagonal. The current pullback in wave (2) is unfolding as a seven‑swing corrective structure, commonly referred to as a double three. From the wave (1) peak, wave W ended at $49.11, followed by a rally in wave X to $56.66. Wave Y is now in progress, with a 100%–161.8% Fibonacci extension target at $35.11–$43.11 (blue box area). Buyers are expected to emerge from this zone, setting the stage for renewed upside momentum.
면책 조항: 본 게시글에 표현된 견해는 전적으로 작성자의 견해이며 Followme의 공식 입장을 대변하지 않습니다. Followme는 제공된 정보의 정확성, 완전성 또는 신뢰성에 대해 책임을 지지 않으며, 서면으로 명시적으로 언급되지 않는 한 해당 내용을 기반으로 취해진 어떠한 조치에 대해서도 책임을 지지 않습니다.

