


Following the breakout in early February, PepsiCo is currently correcting but remains poised to continue higher, potentially improving upon the recovery from May 2025. With a generally bullish outlook, this blog post outlines two likely scenarios and provides guidance for traders.
PepsiCo investors faced a significant downturn, with stock prices plummeting from around $197 in May 2023 to approximately $127 by June 2025 – a 35% drop. However, in our February 16, 2025, blog post, we presented a weekly chart suggesting a potential recovery. The chart indicates that investors may soon see positive returns, and new investors or traders should consider entering the market at a potentially advantageous price with limited downside risk.
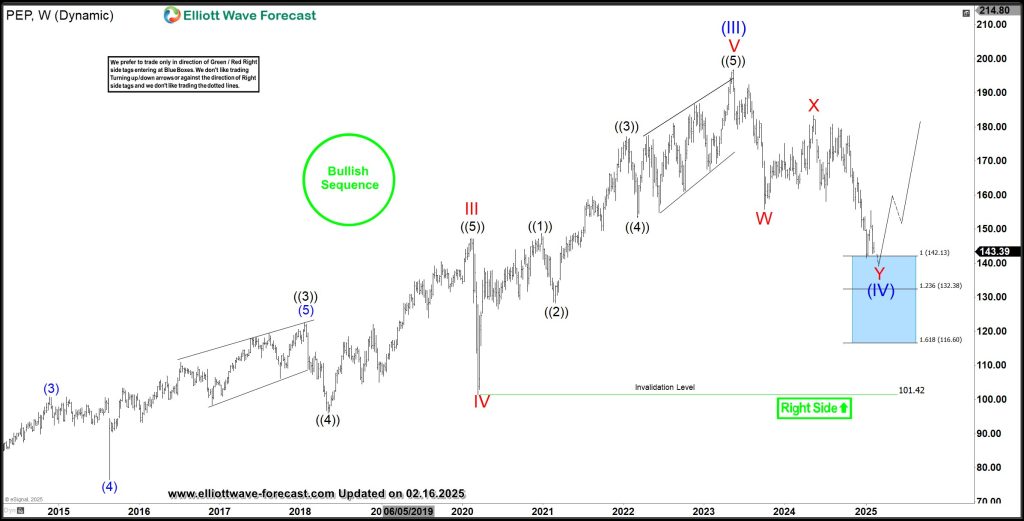
At the blue box, we anticipated wave (IV) to bottom. From the expected low, wave (V) should initiate, with the potential to reach $213-$240 in the coming months. Investors who purchased the stock within that zone, as suggested, should already be profitable, as PepsiCo subsequently found support in the blue box, as the chart below demonstrates.
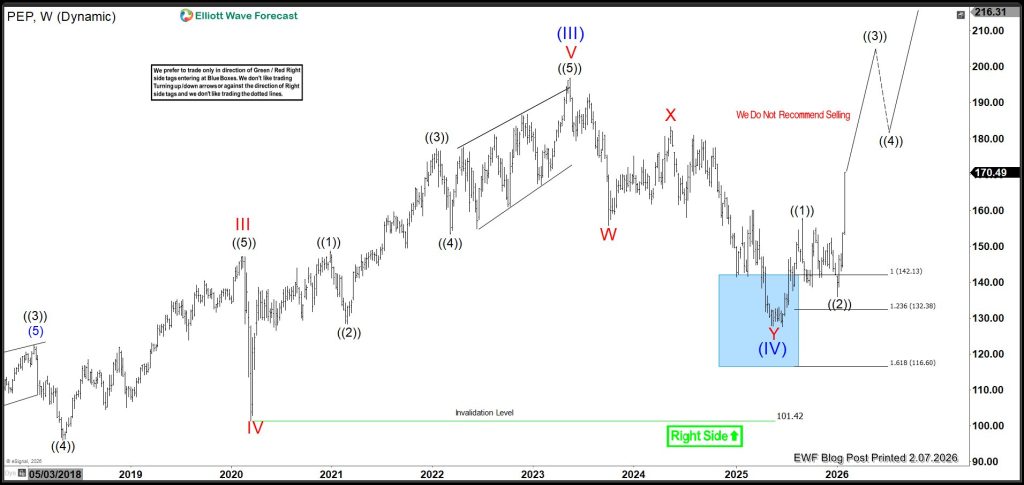
From the blue box, the stock found a trough price of $127 and rallied sharply to $171, an over 34% gain from the low. The last blog update on this stock shared details of the forecast. Since then, the stock has been correcting the gains but remains poised to continue higher. However, there are two possible scenarios for how this could play out.
PepsiCo Elliott Wave Analysis (14th March, 2026 Update) - 1st Scenario
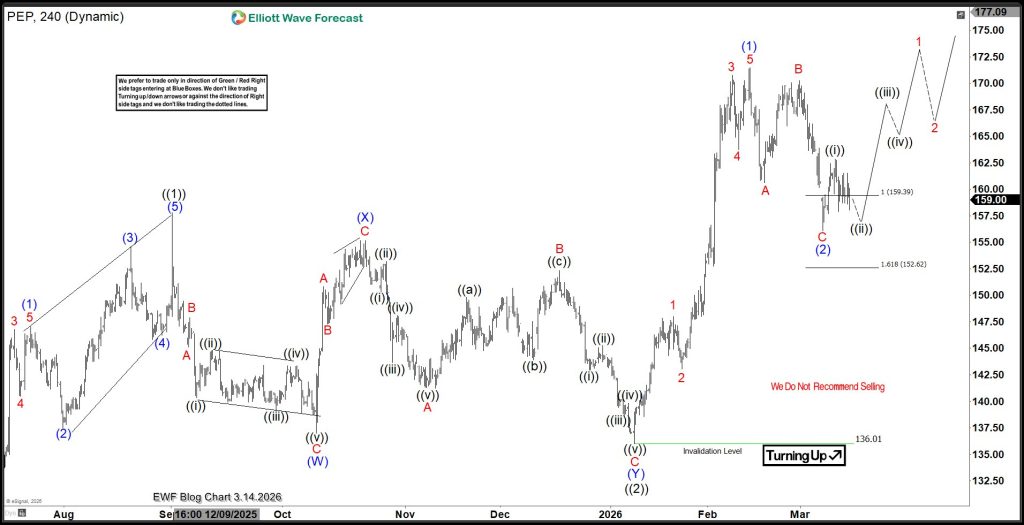
The chart above shows the current pullback as wave (2) of ((3)) of I of (V). The pullback reached the extreme zone of 159.39-152.62 and is bouncing as expected. The bounce could develop into an impulse wave for wave 1 of (3), as shown in the chart, or a corrective ABC/WXY bounce to finish X before moving lower, as the 2nd scenario below illustrates.
2nd Scenario
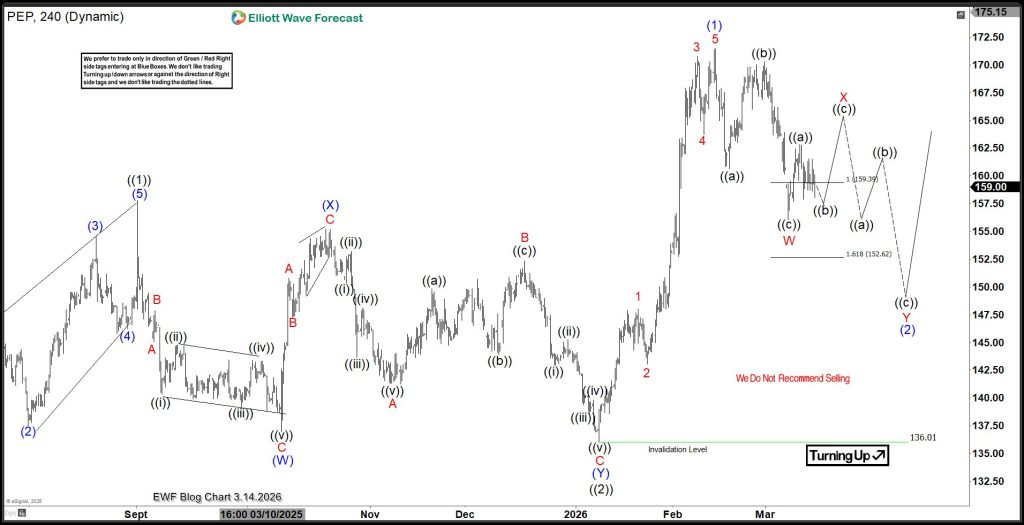
These zones should attract new buyers to join the bullish run. Long-term traders can buy now and set a stop-loss below 136. When the price breaks above the (1) high, they can adjust their position to break even. However, short to medium-term buyers can buy at the zone, but their stop-loss should be below 152.6. Once the price completes a 3-swing, with a potential break of ((a)), buyers can adjust their stop-loss to 57.7 and take partial profit. If the second scenario plays out, short to medium-term buyers can buy again with a stop-loss below 136. This approach allows traders to stay safe in the event of the second scenario or remain profitable if the first scenario unfolds. When wave (1)’s high is breached, traders can wait for the next dip to buy again. Check back for our stock updates or join the thousands of traders in our inner room.
면책 조항: 본 게시글에 표현된 견해는 전적으로 작성자의 견해이며 Followme의 공식 입장을 대변하지 않습니다. Followme는 제공된 정보의 정확성, 완전성 또는 신뢰성에 대해 책임을 지지 않으며, 서면으로 명시적으로 언급되지 않는 한 해당 내용을 기반으로 취해진 어떠한 조치에 대해서도 책임을 지지 않습니다.

