


Chevron Corporation (NYSE: CVX) is one of the world’s largest multinational energy companies. Headquartered in San Ramon, California, Chevron operates in more than 180 countries. It participates in nearly every aspect of the oil and gas industry, including exploration, production, refining, transportation, and marketing. As one of the major global oil “supermajors,” Chevron plays a critical role in supplying energy to the world.
Chevron’s operations are typically divided into two primary segments: upstream and downstream. The upstream segment focuses on the exploration and production of crude oil and natural gas. Meanwhile, the downstream segment includes refining petroleum into fuels, producing petrochemicals, and marketing products such as gasoline and lubricants. Through these activities, Chevron maintains a strong presence in international energy markets.
From a financial market perspective, Chevron’s stock (CVX) is closely followed by investors and traders because it is a major component of both the energy sector and the Dow Jones Industrial Average. In addition to fundamental analysis, many market participants rely on technical analysis to evaluate potential price movements.
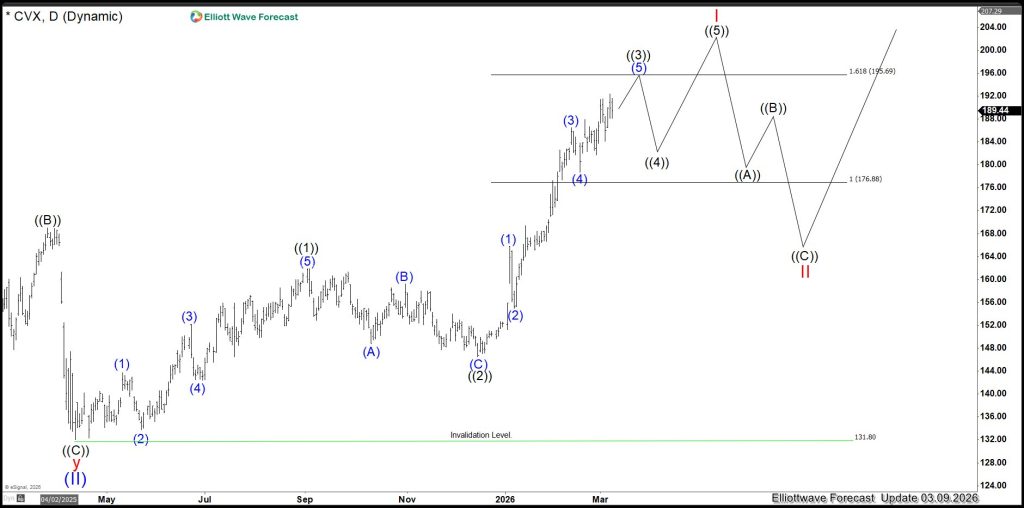
One widely used technical approach is Elliott Wave Theory. It suggests that market prices move in recurring wave patterns driven by collective investor psychology. According to this framework, Chevron’s stock appears to be forming an Elliott Wave impulse structure that began from the lows on April 4, 2025. An impulse wave consists of five waves moving in the direction of the primary trend.
Based on the current structure, the stock appears to be progressing within wave ((3)), which could potentially reach a level around $195.69. After the completion of wave ((3)), a corrective wave ((4)) is expected, followed by wave ((5)), which could push the price toward a projected target near $203.75.
Chevron (CVX) Daily Elliott Wave Chart
From a larger perspective, Chevron appears to have completed three waves into new all-time highs within the Grand Supercycle. In Elliott Wave theory, a trend generally cannot end with only three waves when those waves are moving in the direction of the main trend. Therefore, this structure suggests that the long-term cycle may still be incomplete, implying the potential for further upside.
The current interpretation proposes that the stock may be nesting within a larger Grand Supercycle structure, consisting of multiple degrees of waves such as ((I)), ((II)), (I), (II), and smaller subwaves within them. This type of nested structure often precedes strong accelerations in price as higher-degree impulse waves unfold.
Chevron (CVX) Weekly Elliott Wave Chart
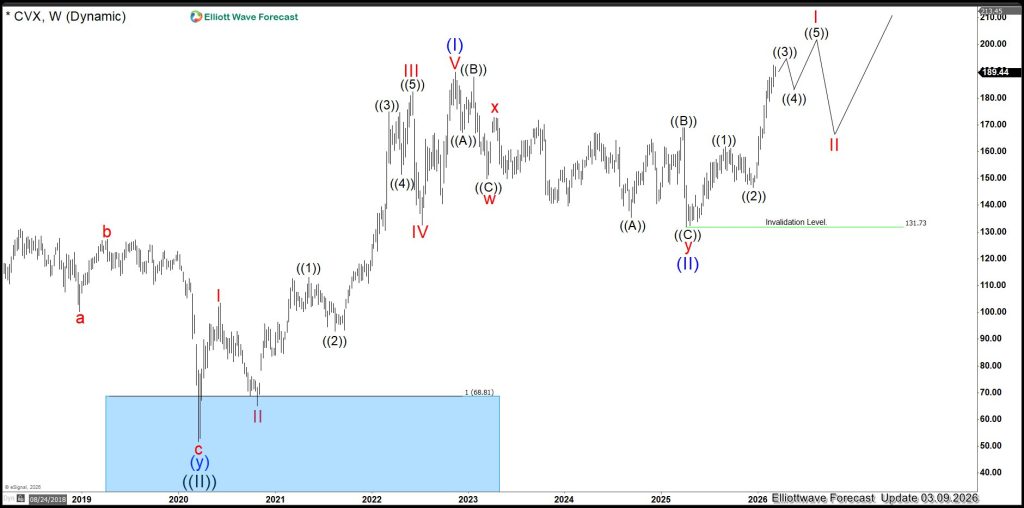
Although some analysts may anticipate a potential crash after visible five waves at higher degrees, the broader market context—particularly the strength of the Dow Jones Industrial Average and the energy sector—does not strongly support an immediate bearish scenario. Instead, the preferred interpretation is that the structure represents a nested bullish pattern, suggesting continued upside potential.
Overall, Chevron’s price action remains bullish, with an incomplete sequence developing since July 4, 2025. The presence of multiple impulse waves within the Grand Supercycle structure indicates that higher prices may still lie ahead, not only for Chevron but potentially for the broader energy sector as well.
면책 조항: 본 게시글에 표현된 견해는 전적으로 작성자의 견해이며 Followme의 공식 입장을 대변하지 않습니다. Followme는 제공된 정보의 정확성, 완전성 또는 신뢰성에 대해 책임을 지지 않으며, 서면으로 명시적으로 언급되지 않는 한 해당 내용을 기반으로 취해진 어떠한 조치에 대해서도 책임을 지지 않습니다.

