Applied Digital Corp (NASDAQ: APLD) operates at the intersection of digital infrastructure and AI innovation. Recent sector tailwinds have fueled strong momentum for the stock. Today, we analyze the Elliott Wave pattern behind its current pullback and emerging buying opportunity.
Elliott Wave Analysis
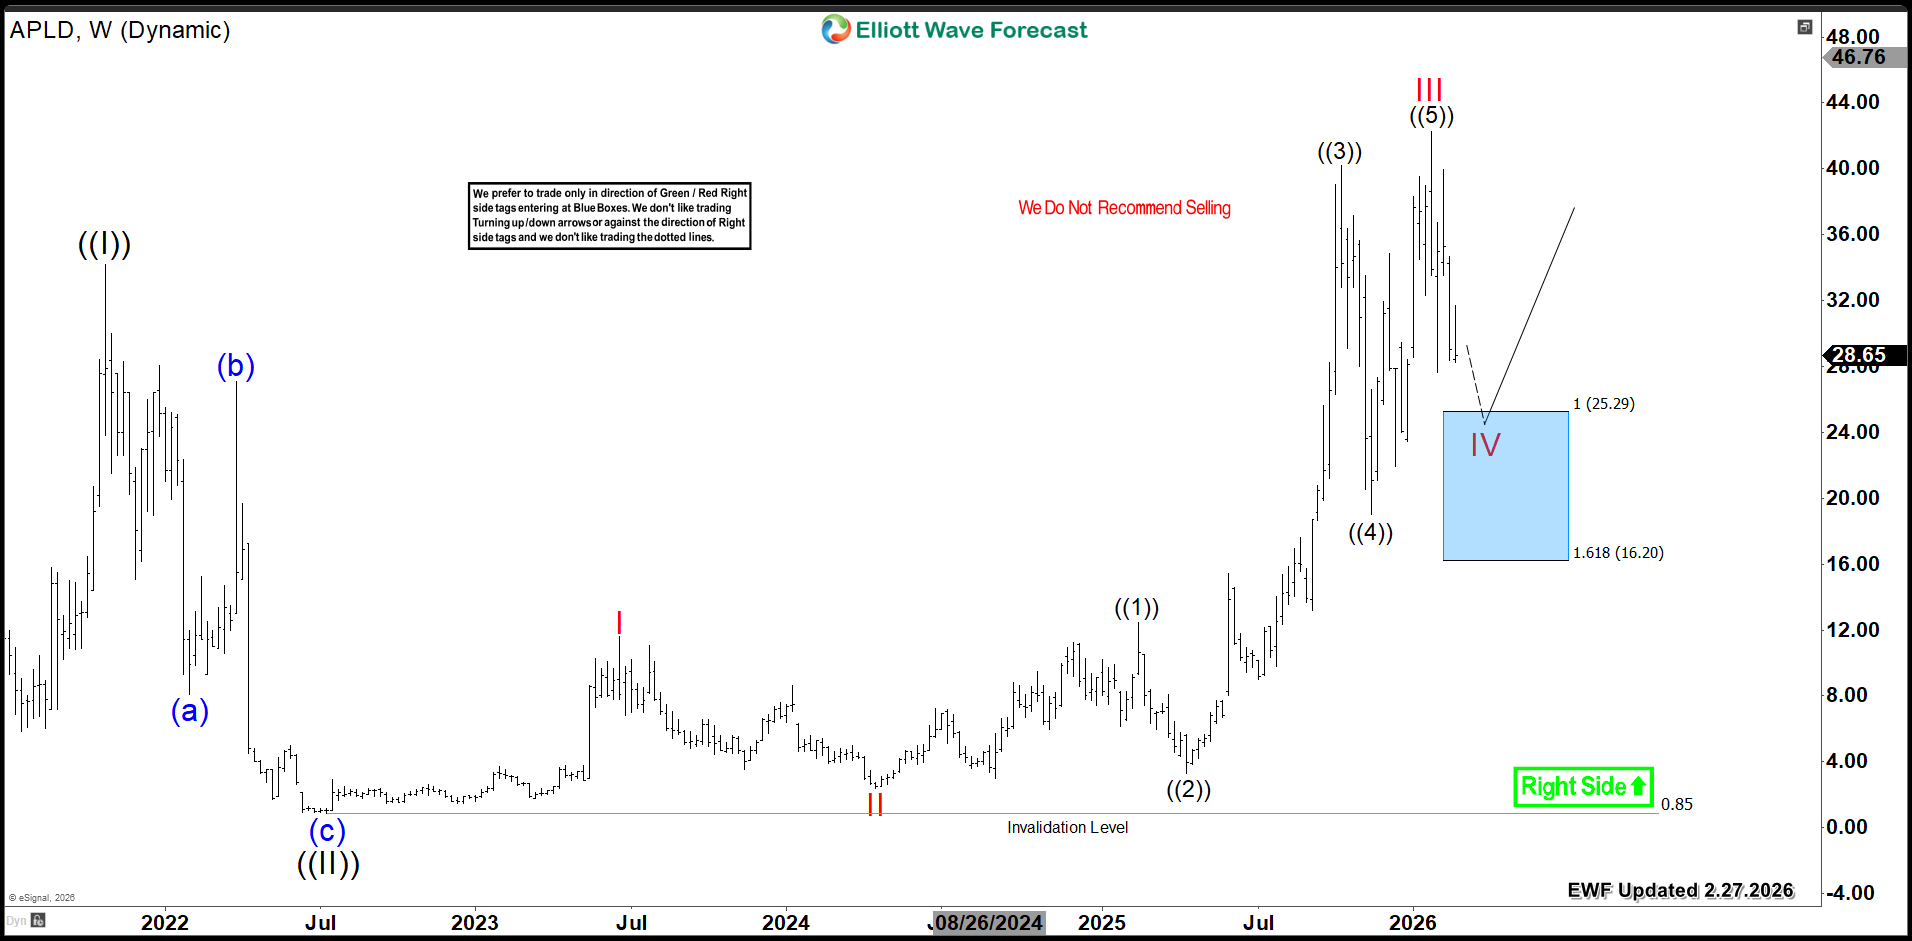
From its 2022 low, APLD created a bullish three-wave advance to new highs. Wave I ended at $11.62, followed by Wave II at $2.36. Then, Wave III rallied to $42.27. Currently, Wave IV is in progress. Therefore, the stock has an incomplete bullish sequence. It aims to complete five waves within wave (I) before a larger correction begins.
The projected Wave IV correction targets the $25.29 - $16.20 Blue Box zone. This high-frequency area should attract buyers. Consequently, price will react to the upside from this zone. It will either resume the rally to new highs or produce a three-wave bounce at minimum.
APLD's next upside move could drive the stock higher. Specifically, it targets the $46 - $52 area within wave V. This advance will occur before the next major correction begins.
APLD Weekly Chart 2.27.2026
면책 조항: 본 게시글에 표현된 견해는 전적으로 작성자의 견해이며 Followme의 공식 입장을 대변하지 않습니다. Followme는 제공된 정보의 정확성, 완전성 또는 신뢰성에 대해 책임을 지지 않으며, 서면으로 명시적으로 언급되지 않는 한 해당 내용을 기반으로 취해진 어떠한 조치에 대해서도 책임을 지지 않습니다.

더 오래된 의견은 없습니다. 소파를 가장 먼저 잡으십시오.