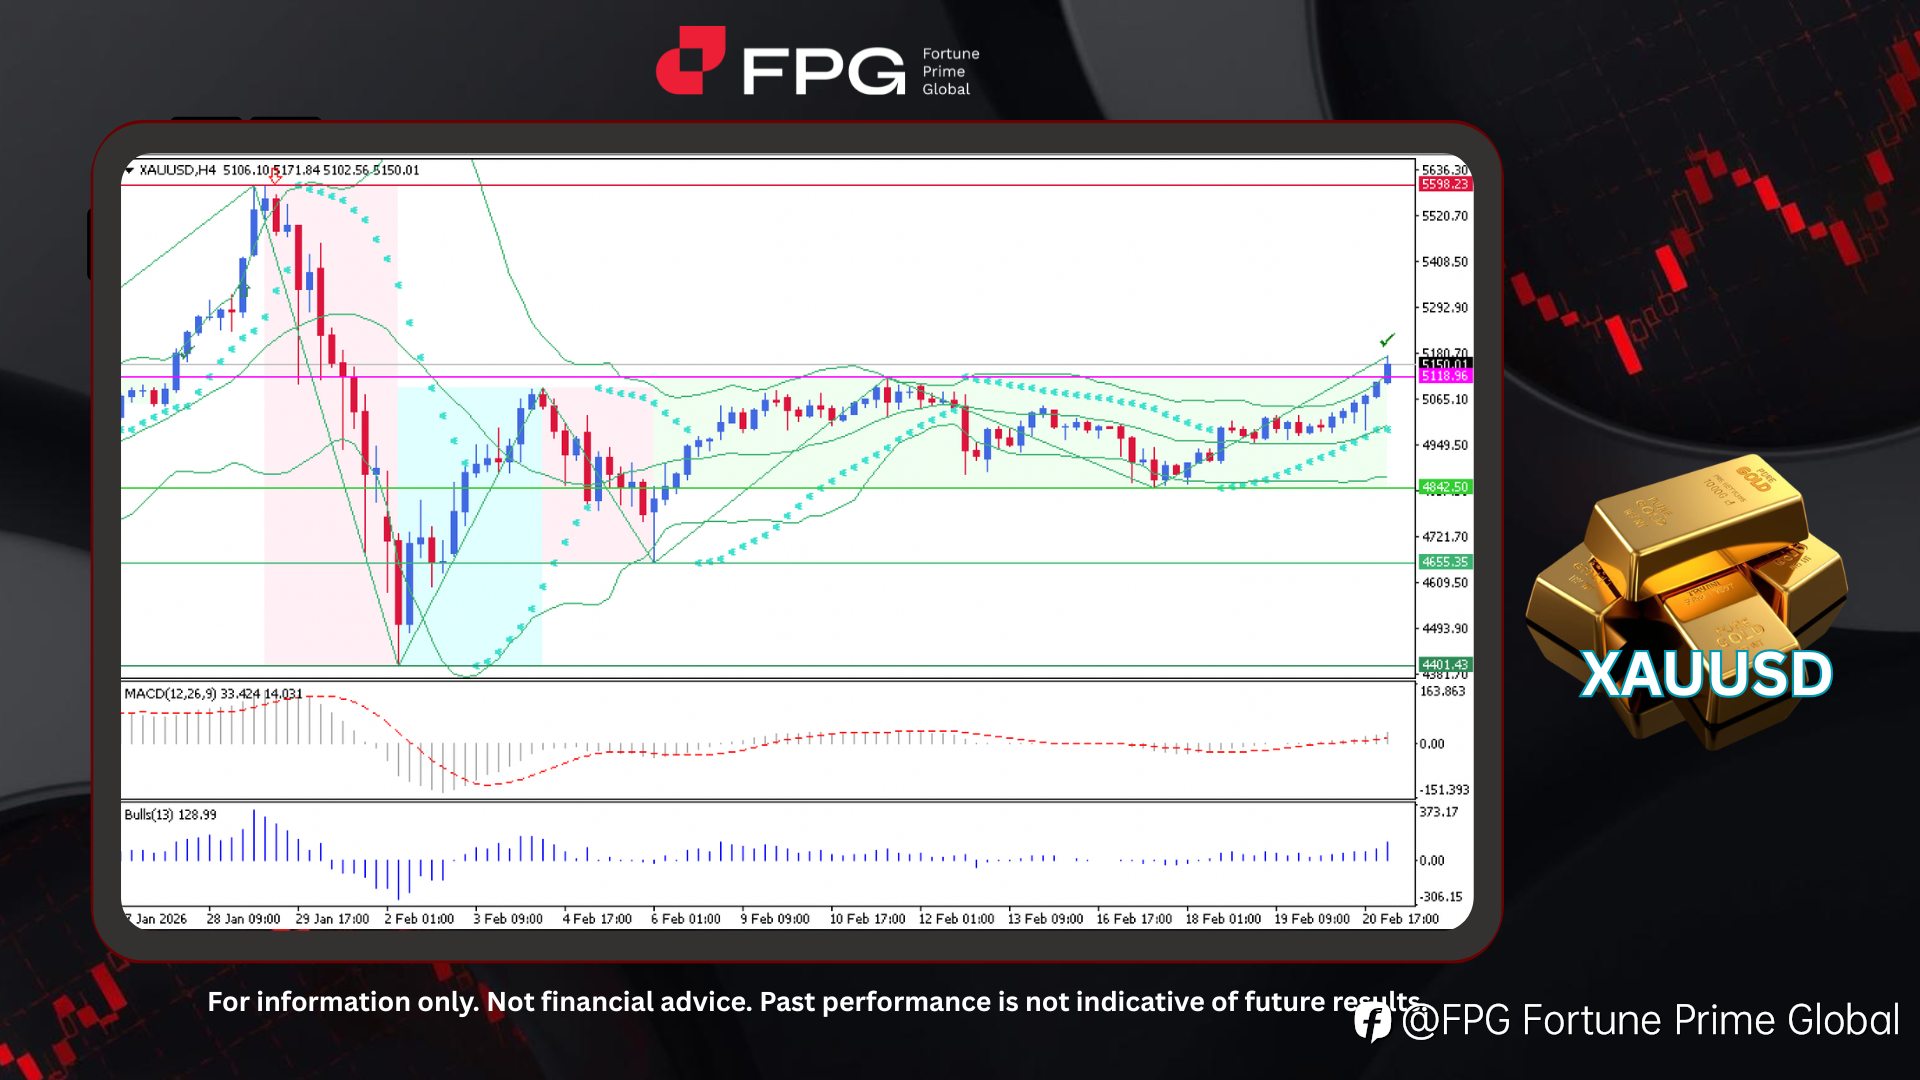
On the XAUUSD(Gold) H4 chart, price experienced a significant decline at the end of last month, falling sharply from 5598.23 down to 4401.43 and establishing a strong bearish impulse. At the beginning of February, gold rebounded from the 4401.43 low, initiating a bullish recovery phase. Although price fluctuated within a broad range afterward, the market gradually stabilized and developed a sideways consolidation structure for several weeks. Recently, price broke above the channel resistance at 5118.96, briefly reaching 5171.84, and is currently trading around 5150.01, reflecting active upside momentum following the breakout.
From a technical perspective, Bollinger Bands show renewed expansion as price pushes toward the upper band, signaling increasing volatility and strengthening bullish momentum. MACD (12,26,9) is positioned above the zero line with a rising histogram, confirming that upside momentum is building after the consolidation phase. Meanwhile, Bulls Power (13) remains firmly in positive territory and continues to expand, indicating sustained buying pressure and strengthening buyer dominance in the short term. Overall, indicators support a bullish bias while also suggesting the possibility of short-term pullbacks after the recent breakout extension.
Fundamentally, XAUUSD has climbed to its highest level in several weeks after softer U.S. inflation data reinforced expectations of potential monetary policy easing. Lower inflation reduces pressure on the Federal Reserve to maintain restrictive rates, which typically supports gold by weighing on real yields. Additionally, persistent geopolitical uncertainty has fueled safe-haven demand, encouraging investors to seek protection from market volatility and declining bond yields. These macro factors continue to underpin gold’s upward momentum in the near term.
Market Observation & Strategy Advice
1. Current Position: XAUUSD is trading around 5150.01 after breaking above the 5118.96 channel resistance, indicating strengthening short-term bullish structure.
2. Resistance Zone: Immediate resistance stands at 5171.84, with stronger resistance near 5598.23 as the previous major swing high.
3. Support Zone: Initial support is located at 5118.96 (former channel resistance turned support), followed by stronger support at 4842.50.
4. Indicator Observation: Bollinger Bands are expanding with price near the upper band, MACD remains above zero with rising momentum, and Bulls Power is positive and strengthening—confirming active buyer control.
5. Trading Strategy Suggestions:
- Bullish Continuation: Consider buy-on-dip opportunities near 5118.96 while price holds above the breakout level, targeting 5292.90 and higher extension levels.
- Breakout Extension: A sustained close above 5180.70 may open room toward higher resistance zones.
- Risk Scenario: If price falls back below 5118.96 and loses momentum, short-term corrective pullbacks toward 4842.50 may develop, requiring disciplined risk management.
Market Performance:
Precious Metals Last Price % Change
XPTUSD 2,170.81 +1.09%
XAGUSD 86.1128 +1.76%
Today’s Key Economic Calendar:
DE: Ifo Business Climate
US: Fed Waller Speech
US: Chicago Fed National Activity Index
US: Factory Orders MoM
US: Dallas Fed Manufacturing Index
Risk Disclaimer: This report is for informational purposes only and does not constitute financial advice. Investments involve risks, and past performance does not guarantee future results. Consult your financial advisor for personalized investment strategies.
면책 조항: 본 게시글에 표현된 견해는 전적으로 작성자의 견해이며 Followme의 공식 입장을 대변하지 않습니다. Followme는 제공된 정보의 정확성, 완전성 또는 신뢰성에 대해 책임을 지지 않으며, 서면으로 명시적으로 언급되지 않는 한 해당 내용을 기반으로 취해진 어떠한 조치에 대해서도 책임을 지지 않습니다.

더 오래된 의견은 없습니다. 소파를 가장 먼저 잡으십시오.