In this technical blog, we will look at the past performance of the 1-hour Elliott Wave Charts of NZDUSD. In which, the rally from 21 November 2025 low is unfolding as an impulse & showed a higher high sequence therefore, called for an extension higher to take place. We knew that the structure in NZDUSD should remain supported & extend higher. So, we advised members not to sell the pair & buy the dips in 3, 7, or 11 swings at the blue box areas. We will explain the structure & forecast below:
NZDUSD 1-Hour Elliott Wave Chart From 2.06.2026
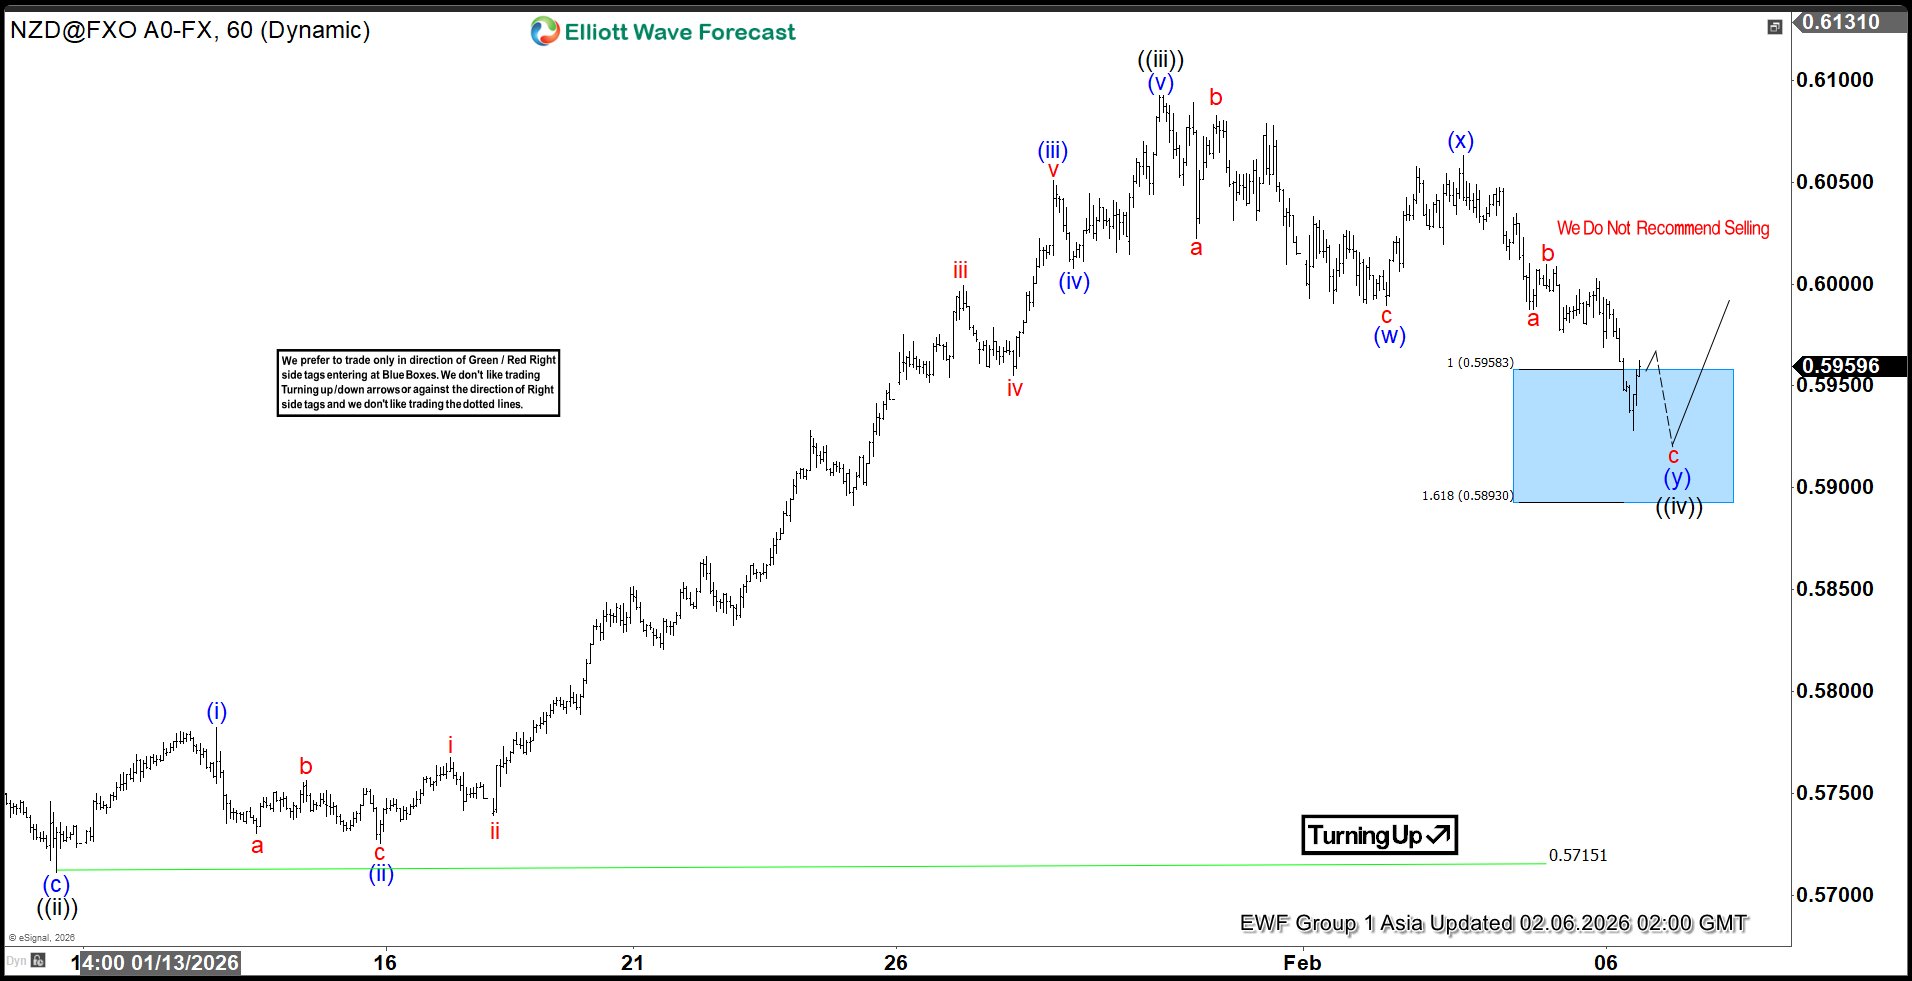
Here’s the 1- hour Elliott wave Chart from the 2.06.2026 Asia update. In which, the rally to $0.6092 high completed wave ((iii)) & made a pullback in wave ((iv)) to correct the cycle from 1.09.2026 low. The internals of that pullback unfolded as Elliott wave double three correction where wave (w) ended at $0.5590 low. A bounce to $0.6063 high-ended wave (x). Then started the next leg lower in wave (y) towards $0.5958- $0.5893 blue box area. From there, buyers were expected to appear looking for new highs ideally or for a 3-wave bounce minimum.
NZDUSD Latest 1-Hour Elliott Wave Chart From 2.14.2026
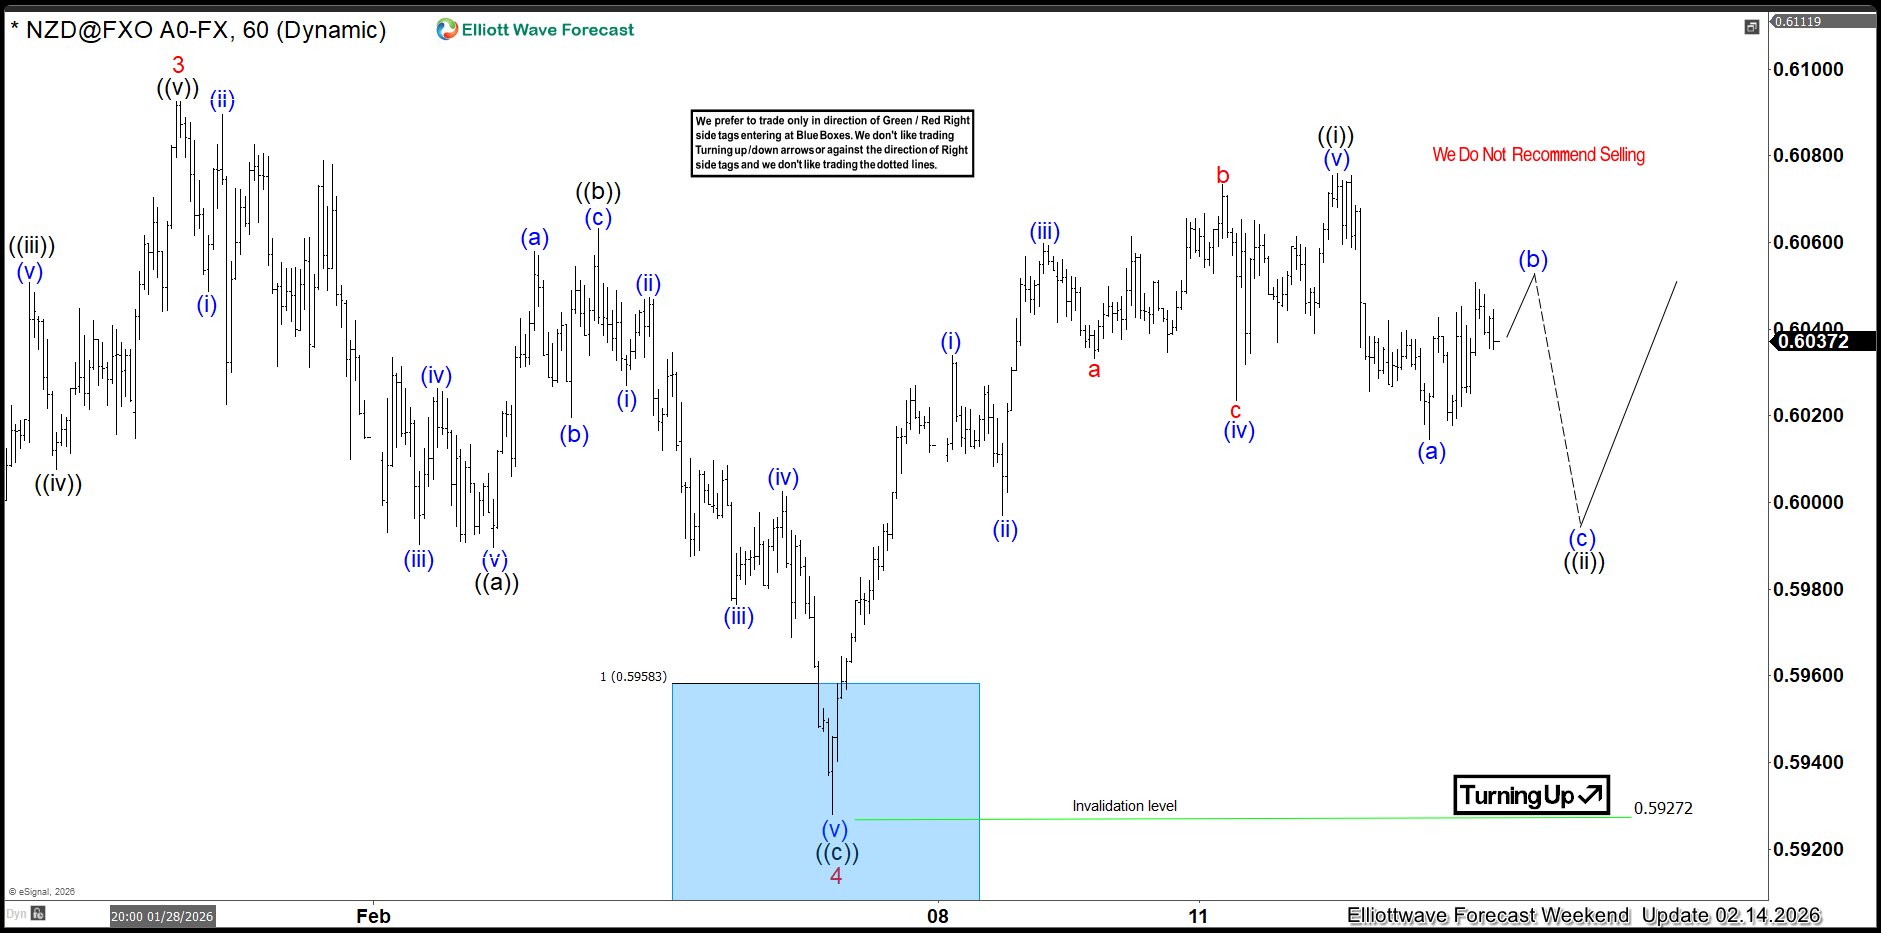
This is the latest 1-hour Elliott wave Chart from the 2.14.2026 Weekend update. In which the pair is showing a strong reaction higher taking place, right after ending the correction within the blue box area. Allowed members to create a risk-free position shortly after taking the long position at the blue box area. However, a break above $0.6092 high is needed to confirm the next extension higher. Targeting $0.6131- $0.6194 ( minimum extension target) and avoid deeper correction lower. As additional data became available, label intensities were refined and corrected to ensure greater accuracy.
면책 조항: 본 게시글에 표현된 견해는 전적으로 작성자의 견해이며 Followme의 공식 입장을 대변하지 않습니다. Followme는 제공된 정보의 정확성, 완전성 또는 신뢰성에 대해 책임을 지지 않으며, 서면으로 명시적으로 언급되지 않는 한 해당 내용을 기반으로 취해진 어떠한 조치에 대해서도 책임을 지지 않습니다.

더 오래된 의견은 없습니다. 소파를 가장 먼저 잡으십시오.